Friday Paper Charts
August 18, 2023
Another eventful week has passed. It is a strange feeling. While the bond and equity weaknesses are orderly, I somehow can not feel confident in taking much risk. Not sure about you, but I am shooting only for small singles here and there. While profitable, I have the sense I might lose it all and more in one random session. These are summer markets for you in a nutshell.
It’s been another busy week at Paper Alfa; there is no summer lull here. I have published the following:
ATW looked at the parallels between fantasy football and investing. It also includes a segment discussing the Fed’s current neutral rate and maybe some of the current narrative behind the ongoing curve steepening. As usual, there are a few extra charts and watch lists for subscribers.
Again, we had two Model Signal Alerts. You can find them here and here.
I also added another educational piece which I have worked on. This time, it’s about STIR Futures. I tried to cover the basics, some popular trade applications and complexities.
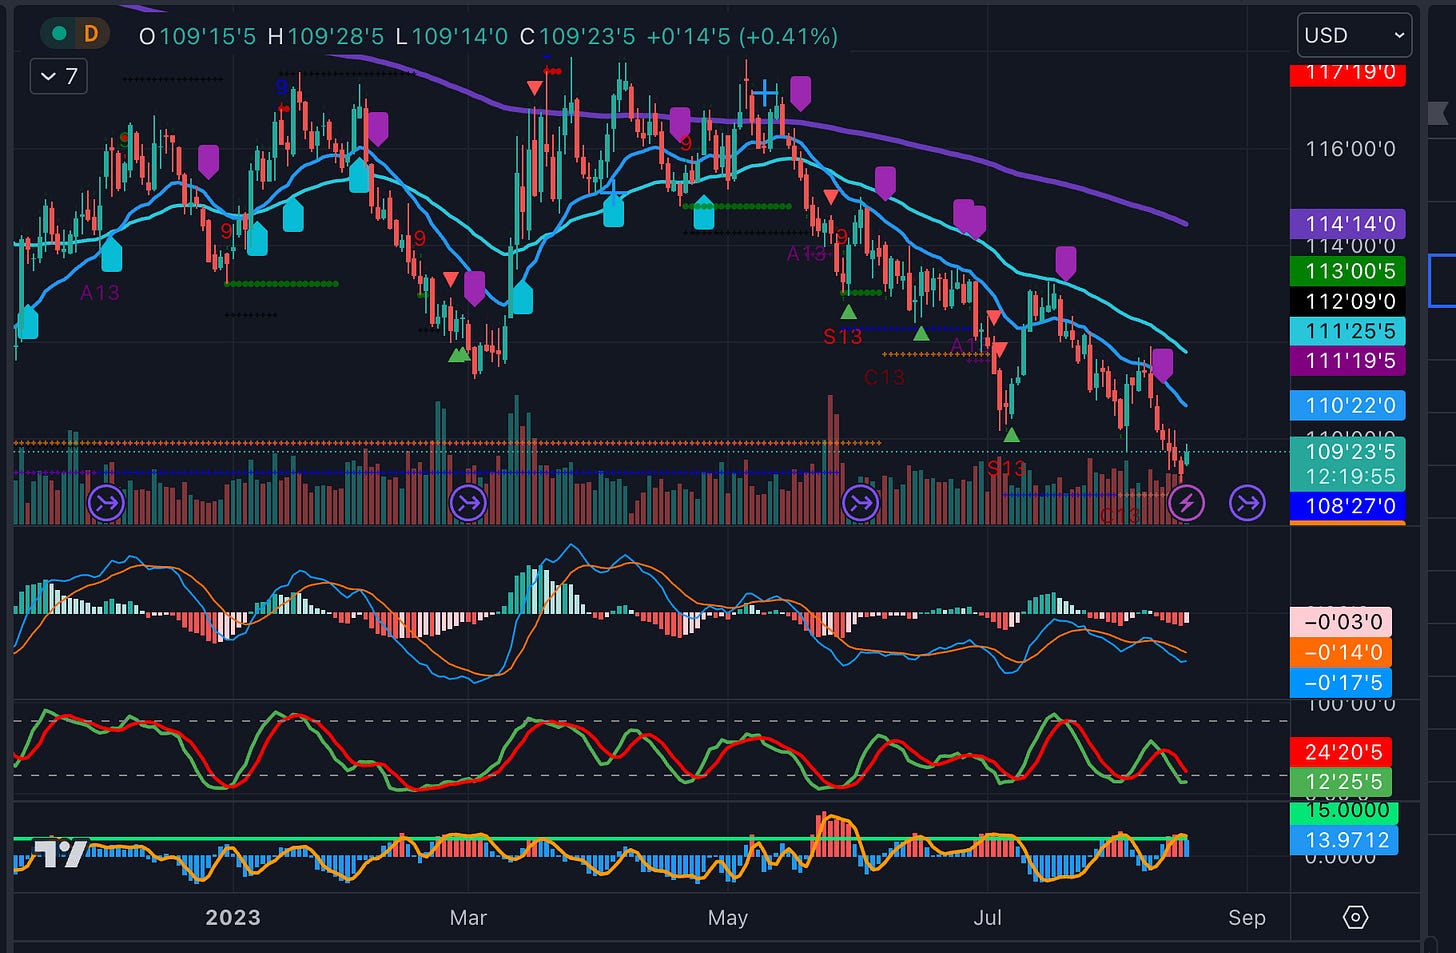
Bonds are still trading very poorly. While we broke recent lows on a closing basis, the market, at least based on my indicators, is oversold and hence looking for a relief rally which we are again attempting this morning (UK time). The indicator has worked well over the recent past, so let’s see whether we can catch a bid over the next few sessions.
It’s also worth highlighting where the yield curve currently stands in historical terms. I wrote about this in Tuesday’s Model Signal Alert.
Comparing the current treasury yield curve to history also puts things in perspective. Precisely 16 years ago, in 2007, the yield curve was notably steeper. Remember that the Fed cut the discount rate on August 17th, 2007, by 50 bps after the market already showed significant stress. The FOMC then cut rates by 50 bps a month later on September 18th. The pink line shows the curve as of today in 2007, while the green line is the current yield curve.
I have also plotted the yield curve as of Dec 31 2007 (yellow), which was when the Fed had already cut rates by 100 bps to 4.25%. Be mindful of how much is already priced into the current curve.
Meanwhile, in credit space, spreads are tentatively widening, although that’s a pretty small move. Surprisingly still, given the recent bond sell-off and steepening.
Let’s dig into the rest. I have assembled a record 70 charts. Overall, there are quite a few reversal signals flashing. I have added a bit more sectoral charts to US equities for better context. I hope you find this useful.


