Friday Paper Charts
January 9, 2024
Bond markets are still in a transition phase, which is important to monitor as it will likely beat the drum across other asset classes. Zooming out, US Q4 GDP was the largest quarterly surprise since 2020. January jobs saw the biggest headline surprise in a year. Should we really be that surprised after a record monthly easing in financial conditions back in November and December last year?
Looking at economic surprise indices, the pick-up in US and European data is noticeable. It’s also surprising to see the UK slip in the manner it has, while Chinese subdued readings seem to be stabilising.
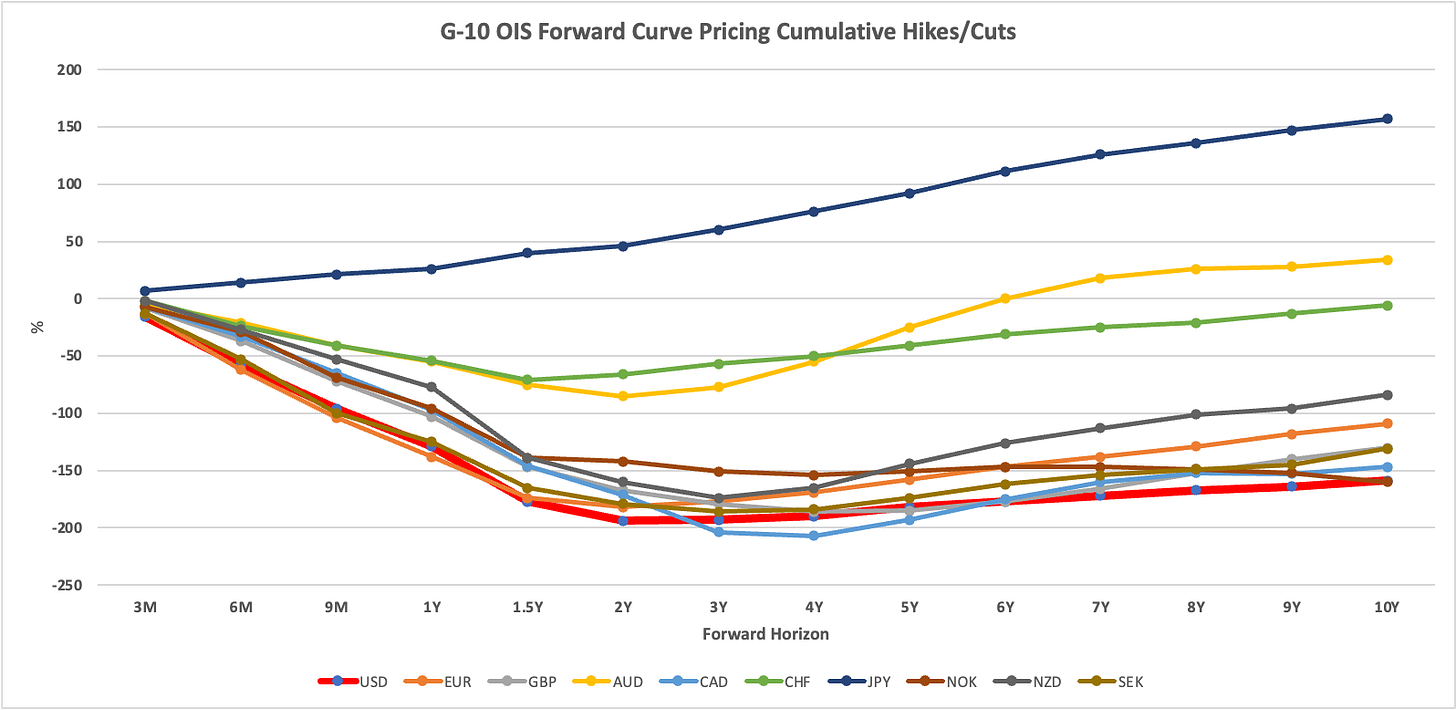
Meanwhile, OIS pricing has adjusted across the curve, reflecting the death of a March cut probability. The fat red line is the US, where terminal pricing is now closer to 3.5%.
This is in line with a cumulative cycle adjustment of 200 bps, which is pretty much in line with EUR pricing.
The 1-month change makes it clear how much we have adjusted so far, with the US market being one of many G-10 markets which have seen some decent adjustment.
Street research is anticipating the sum of rate cuts to be around 1500 bps over the next 6 months. This includes 22 countries on their list. That’s a lot of easing lined up in the pipeline.
The argument for a weaker USD has to be held against those expectations, with any move following interest rate differentials closely, as the following chart shows.
As I opined in yesterday’s post, the case for further equity gains is still intact, with the dominant forces of disinflation, a monetary policy pivot, and resilient earnings still providing the necessary thrust.
Absent a material reacceleration of inflation (which means goods deflation/disinflation stalls and reverses sharply higher, services prices stay stubbornly elevated, and rent/shelter costs fail to break lower), monetary easing will likely arrive within months. Whether March has been killed doesn’t really matter for the equity game for now. The updated projections are unlikely to portray a different picture to December, and, as such, the messaging will still be relatively dovish.
Let’s now put our attention to the charts. A few things were triggered last week, mostly in bonds, where momentum has now shifted to short while taking a more positive stance on the USD, which has broken out of the recent range.
I appreciate your interest in obtaining the TradingView scripts, which I have made available to subscribers. I still have a backlog to work through, so I thank you for your patience. Those who are interested, please get in touch. Paying subscribers will have priority.
So, let’s have a look at where we currently stand. Be ready; 100+ charts are coming your way!
If you need a guide, read this first. Also, for the script users, you can view a quick user guide here.
Let’s go!


