

Has the Risk Rally only just started?
Assessing the current State of Play

As we are nearing the 5000 SPX-hat moment, I thought it would be useful to put some thoughts into the current rally. Whenever we near a new ATH, I can sense both excitement and frustration. Opinions are divided on how long this party can continue.
Don’t get fooled into looking at the chart and calculating what the return on your portfolio would have been. Only a fraction of people get close to realising those stellar returns. The reasons are fees, withdrawals, rebalancing, and many behavioural factors.

Over the past few years, there have been plenty of macro waves to navigate. Of course, they are always obvious in hindsight. Once in a while, there are special constellations that make for a great trading year without any major hiccups. The last one of those was possibly 2019 and then 2017. Note that both years followed the tumultuous years of 2016 (China de-peg, Brexit, Trump) and 2018 (inverse Vix blow, Powell R-star Christmas pooper).
Based on these simple conditions, 2024 shouldn’t be a great year, right? My usual strength of sidestepping and monetising bad periods is deeply rooted in my ability to cut risks and take calculated positions which profit from increased volatility. A convex anti-fragile concept, ideally. I do, however, occasionally miss out on fully participating in great runs. Is this year one of those?
You could argue that the much-forgotten Fed put has entered the playing field again. Inflation-fighting credibility has somewhat returned, leaving some policy room to manoeuvre rates lower from here, supporting growth, earnings growth and multiples. The bullish side in me would concur that the Fed has earned the right to once again backstop growth and employment risks in a more traditional symmetrical fashion relative to inflation risks. Whether such a backstop will be needed this year is another story, but if last year’s mini-banking crisis is anything to go by, the put is certainly deeper in the money one year on.
The KISS (Keep IT Simple Stupid) script is pretty simple: Does the timing and extent of cuts really matter for where this equity train is headed? The key is that the Fed doesn't have to inflict pain any longer. The supply-side inflation battle is essentially over, and we can now return to a more traditional Fed policy reaction function.
The more suspicious side in me wonders how much steam is behind this boat, which seems to be lifted by increasing behavioural dynamics fuelled by a belief system powered by revolutionary AI technology and a possible productivity boom further ahead. A possible scenario by all means, but how much of it is already priced? The chart below might suggest that the extent of the AI rally is relatively benign in comparison, although I would say there is a logical fault in assuming that every bubble carries similar dynamics.

Are we possibly in the final stages of a blow-off top, usually characterised by a final almost exponential price move, which concludes the final act of a rally?
The chart of the Nasdaq looks bullish and extended when looking at monthly Bollinger bands, but it doesn’t look like the exponentially driven run-up we have witnessed in the 99/00 (lower chart) pop of the internet bubble.


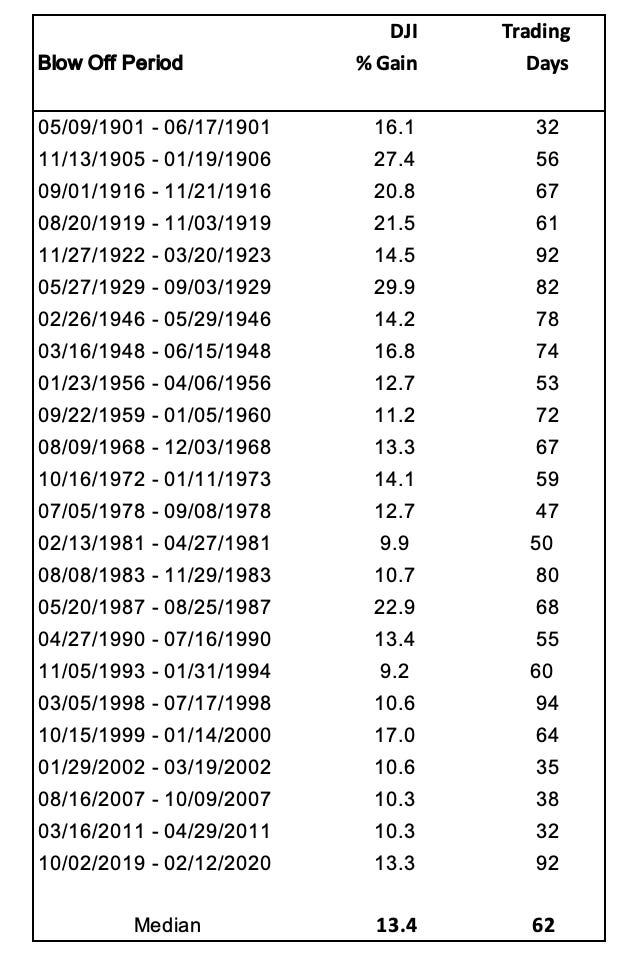
We actually have data from the excellent NDR research house that shows blow-off tops heading into bull market peaks. The median gain is 13.4% over 62 trading days. They are using DJI data for more history.
The DJIA has jumped 19.3% since the October correction low 69 trading days ago. So, on the surface, the rally has the potential to be a blow-off top.
The crux, however, is that it's hard to define and quantify blow-off tops. A big rally with narrow participation would usually bring a much higher risk of a blow-off top. Currently, though, breadth remains bullish.
As always, sentiment also plays a crucial role. Persistent optimism in the face of bad news is generally a hallmark of a blow-off top. I still observe some scepticism and only mild euphoria. Various sentiment readings, however, are suggesting record optimism all around.
Those who have read my piece on technical analysis know my approach to market structure analysis. The current episode is a very clear structure A (strongly bullish), which is characterised by a non-symmetrical reaction to good and bad news and a very quick recovery from temporary setbacks. Equity markets rarely move from A to E in one go but rather transition. For a transition to B (mildly bullish) to occur, we would need the following conditions to appear:
Falling Market Breadth
Diverging Trends in Sub-sectors
Turn in Trends after a sharp acceleration
No reaction to good news
Negative reaction to bad news
On Technical Analysis ...

If you have been a follower, you will know that I do intensively look at technical patterns when determining likely market moves. I have to admit that I used to laugh at technical analysis (TA) in my earlier years. I was a more fundamental investor back then, dismissive of behavioural patterns that might repeat.
So far, none of those conditions have been met. Where does that leave us? Taking emotion out of the current setting, I’d still be playing with what the momentum models and the market structure analysis have been telling us since the beginning of November, and that is to be long the DJI, which we used as an example above.
It is tempting to take profit early and possibly prudent to take some chips off the table. I know some people opine that the performance clock starts daily; that might intellectually be true, but in reality, you can risk more if you sit on a good cushion of PnL, rather than running a trade since yesterday.

Concluding, I view the current setting as follows:
Major stock markets have entered a phase where:
Market breadth is likely to print above 60%.
Moderate upward trends are likely in broad indices.
Sector preferences may shift over time.
This scenario could be threatened by further geopolitical shenanigans and weaknesses in China and several Asian markets, although China's long-standing issues are unlikely to bring surprises.
The global market structure is one of a broadly supported upward trend in North America, Europe, and Japan, with occasionally shifting sector preferences and impacts on regions. Consolidations will, no doubt, occur, but significant market changes usually take time.
I will observe all factors mentioned above and revert should anything change.
For now, get your 5k hats ready and enjoy.
Thanks. Well done 👍🏽