TradingView Script Guide
Short Intro to the Scripts
Thank you to everyone who has contacted me and requested to obtain the TradingView (TW) scripts, which entail the moment & reversal model. It also includes the TD count setups, which I occasionally mention in my post. If you are interested in getting access, get in touch.
Note to those of you who are running the free TW platform: I believe you can only have two indicators per chart. Still, it would allow you to run both the momentum and reversal model, for example.
Once you have been granted access, you will have a screen that might look like the one below. Everyone has different colour preferences, but the colours of the indicators are set in stone.
Let’s look at the signal of each model in isolation.
Momentum Model
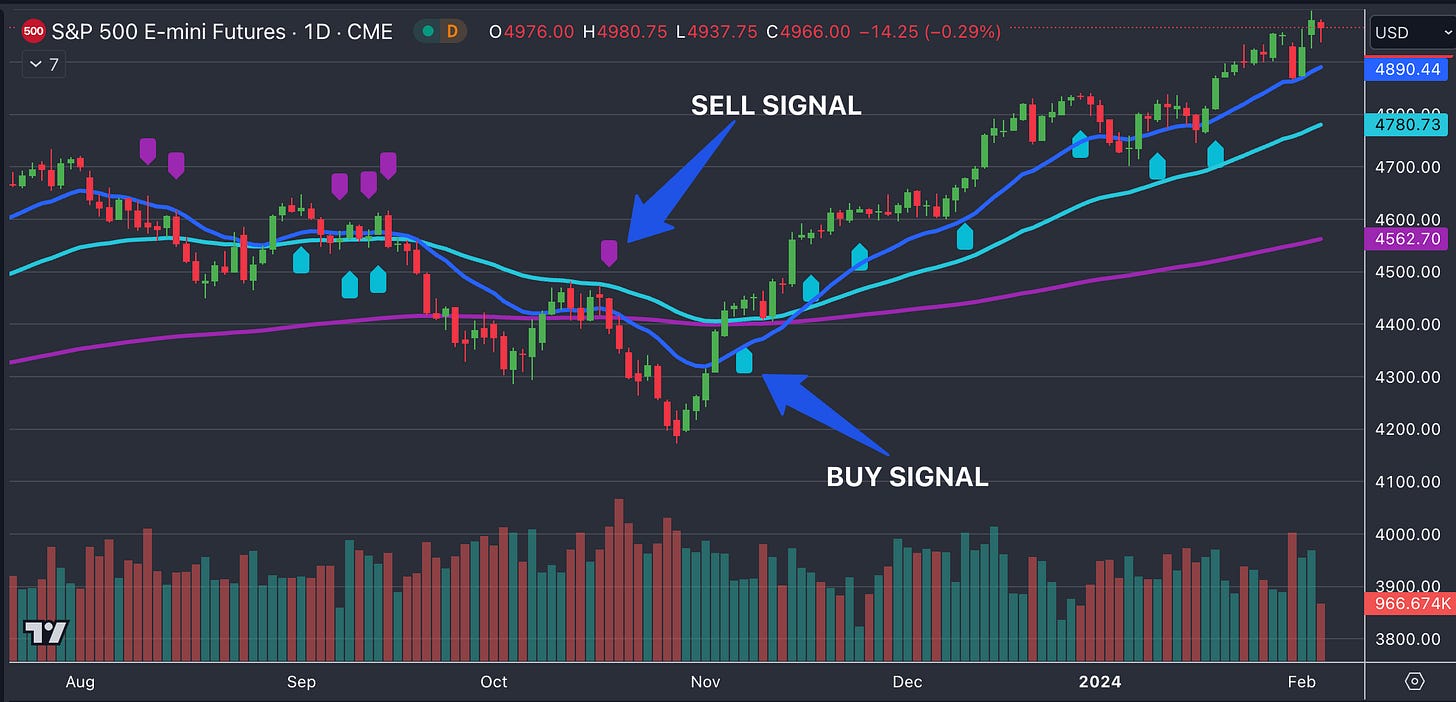
The momentum model signals show buy (green-blueish) markers and sell (purple) markers. The standard time setting is daily, which I personally use. You can also use it on longer time frames like weekly and monthly. I haven’t tested it on shorter time intervals, like hourly or 4-hourly.
When a Buy follows a Sell marker, that means that that Model has flipped too long. If you were running positions and, say, you were short three units, that would make you switch and be long one unit if that’s how the strategy is set up to be.
As you can see, the momentum model will signal a layered long or a short, meaning that it will add to the existing signals when certain conditions are met.
A higher number of buy or sell signals indicates a higher degree of certainty that a prolonged momentum move is in force.
Reversal Model
Again, using the example of the mini-SPX futures, the reversal model is seeing either buy (green) or sell (markers), indicating that an existing trend is likely to face exhaustion and consolidation. It’s a warning not to chase the prevalent trend.
In isolation, as the chart shows you below, it can be viewed as a simple buy or sell signal. If you have been following my charts, you might ask yourself where the reversal window is.
The reversal window, as a refresher, is the bottom chart in my normal chart updates, showing a histogram, where red bars signify a window where a reversal signal typically occurs. I have recently added a script where you can add the “classic” histogram, as seen on my chart packs separately.
I have simplified this in the scripts in that the reversal window is showcased by yellow bars before a signal is typically triggered. You can change the colour code on your specific set-up, given that you might have your own candle bar colour scheme set.
A reversal signal typically does not change the prevailing trend. It is a good indication when not to press for directionality as a likely exhaustion point is being reached. In this case, it is prudent to wait, reduce, or reverse positioning if you want to trade it more aggressively.
TD
The TD setup is also in a script, although I am only using it as a secondary indicator.
The Demark tools are designed to predict potential price activity and aid in timing market entries and exits. Among the several indicators DeMark introduced, the TD Sequential and TD Combo, which employ the 9 and 13 counts, are particularly popular.
The TD Sequential indicator seeks to identify potential price exhaustion and the likelihood of a reversal. It consists of the setup phase and the countdown phase.
a) Setup Phase (9-count):
A "buy setup" requires nine consecutive bars where the close is less than the close four bars prior.
A "sell setup" involves nine consecutive bars where the close is higher than the close four bars earlier.
After completing a 9-count setup, a reversal is expected but not guaranteed.
b) Countdown Phase (13-count):
After a buy setup, the countdown starts when the next bar's low is less than or equal to the low two bars earlier. This process continues until 13 counts are achieved.
After a sell setup, the countdown begins when the next bar's high is higher than or equal to the high two bars prior. This goes on until 13 counts are reached.
The conclusion of a 13-count suggests a stronger potential for a reversal than the 9-count.
While similar to the TD Sequential, the TD Combo seeks to identify reversals faster. The 9-count setup is the same, but the countdown phase is slightly different.
a) Setup Phase (9-count):
Similar to the TD Sequential setup.
b) Countdown Phase (13-count):
For a buy setup, the countdown starts immediately when the close is less than the low two bars prior.
For a sell setup, the countdown begins when the close exceeds the high two bars earlier.
Like the TD Sequential, completing a 13-count in the TD Combo indicates a stronger potential reversal.
In the chart above the Combo TD is identified by a the letter “C” in front of the 13 count. similarly, the Sequential TD carries the letter “S”. An even more aggressive form can also appear with the letter “A” in front of the numbers.
I use the TD only in combination with my more important reversal signal. If they both trigger close to each other, I would have a higher conviction.
ALL-IN-1 CHART
Let’s look at all indicators in one go. Note that I am also using the 20, 50 and 200 ema as reference points.
I’m using the mini-SPX future as an example here.
Let’s start in September of 2023, where we were mostly witnessing a ranging environment, signified by a flipping momentum signal and coiling candles close to the 20/50 ema lines. The last signal (short) took us below the 20/50 ema line, which then gave way to a test of the 200 ema line.
At the 200 ema line we are encountering a first indication of a reversal window, highlighted by the yellow bar. This means that an exhaustion pattern is building. We are awaiting a green buy triangle, which then ultimately gets triggered. This urges for caution to press shorts and does not generally mean that a trend will fully reverse, although this can happen to as I will show later.
After flipping lower for a few trading sessions, a reversal then plays out, taking us above the 200 ema line and close to the 50 ema resistance. Given that there was no momentum change to long, another momentum short marker appears just as we are turning lower from the 50 ema line.
We are indeed turning lower again, crossing below the 200 ema line. Momentum is firmly short. Again, we are facing a yellow candle, indicating a reversal window is open. Note that we can also get red triangles. Those are just signifying that the reversal signal is close but, in case of a buy reversal, needs a green daily candle for a reversal signal to occur. We get two buy reversals in close order, followed by a big bounce above the 20, then 50/200 ema lines. Note that close to the reversal signal we also have a TD C13 buy set-up, supporting the reversal view.
The last, and ongoing, act is the rally from the flip in momentum signal in early November, when we closed above the 50 ema line. This is followed by a few other buy signals along the way.
We also witnessed several TD 9 and 13 counts along the way with only limited results in terms of consolidations.
So here you go with a simple enough guide when you are looking at the scripts in TradingView.
If you have any questions or feedback, just send me an email and I will do my best to get back to you.
I will hope to follow up with a few videos, which will also be helpful to your understanding.
Enjoy!


Question, is there any link where we can download your TradingView setup/script ?
Thank you 🙏