

When to Buy Bonds 3
Is it finally time to load up?

This is the third incarnation of “When to buy bonds”. Please look at Series 1 and Series 2 to review some of my previous reasoning.
In short, back in December, I concluded that buying duration (be long bonds) is generally not advisable as long as the hiking cycle is still in full force. Consequently, I looked at better expressions around yield curve positioning with 5-30s steepeners offering the best potential risk-reward.
In the sequel post the banking fallout I looked at what markets were pricing which was even in comparison to the onset of the 2007/2008 crisis already quite extreme. The conclusion was while all signs would point towards an immediate disinflationary impulse, bonds had already priced in such a scenario and that risk-reward would not warrant going long yet. I was waiting for a backup in yields as a result of my logic.
We now had this back-up in yields since then as highlighted in the below graphic which shows the treasury yield curve as of close yesterday (blue) and the one from April 3rd.

Is there value in bonds now? Let’s look at the various maturity segments for some clues.
The good people at Chatham Financial have a handy little tool if you don’t have access to any of the professional tools out there.
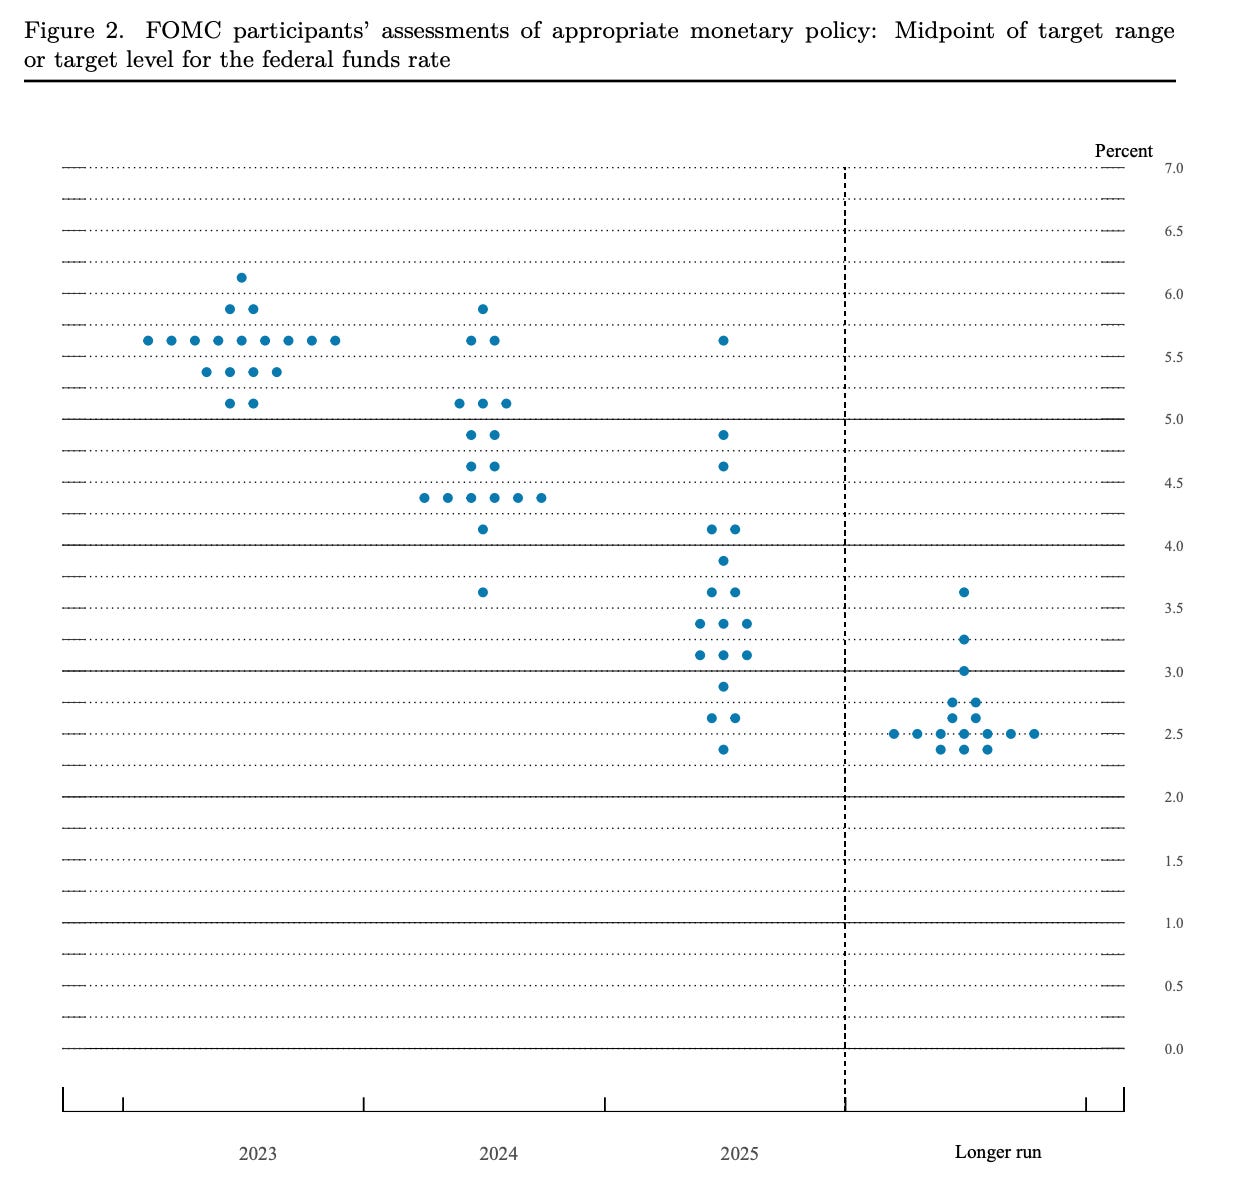
Below, you see the implied market rates for 3-month SOFR rates going forward as well as the FOMC dot plot and median (blue dot).

Disregard the longer-dated forwards from say 2028 onwards as those markets usually get less liquid. You can see the already anticipated easing cycle for the FOMC which is expected to start in early 2024 (at least some probability is being priced).
Simply looking at the current pricing of SOFR 3-month Futures:
SOFR 3-month Spot: 5.23%
Dec-23 SOFR Future: 5.23%
Dec-24 SOFR Future: 3.76%
Dec-25 SOFR Future: 3.27%
So, in simple terms, market expectations for the coming two calendar years are:
2024: - 1.47%
2025: - 0.49%
I will cover the intricacies of front-end pricing in a separate post as there are a few dynamics to be aware of. One of them is looking at 3-month horizons. So just briefly looking at a future which is expiring in December is not really looking at what’s priced in from year-end onwards as the 3-month future will also be capturing the entirety of the first quarter of 2024 in Dec-23’s case. This might be a minor point for this exercise but the bread and butter if you want to trade meetings and dates accurately.
What is the Fed’s long-term neutral rate? According to their latest forecast that is still firmly at 2.5%.
So far, raising rates by 500 bps and possibly by 550 bps did not come with any economic fallout yet. Given that we are now looking at 1-year and 2-year out it would be quite reasonable to conclude that the market is considering the Fed to be too tight further out given the already amassed tightening that still has to feed through the system.
The higher they ramp up rates, especially into a slowing economy, the faster, in my opinion, they will have to ease back. As such, you can argue that 2024 and 2025 SOFR rates are possibly 100 bps too tight. It can be argued that the 2.5% neutral rate should be the upper limit as to where rates should settle. Clearly, the market is still attaching a higher risk premium as to how much higher for longer the Fed will have to keep rates at to cool inflation.
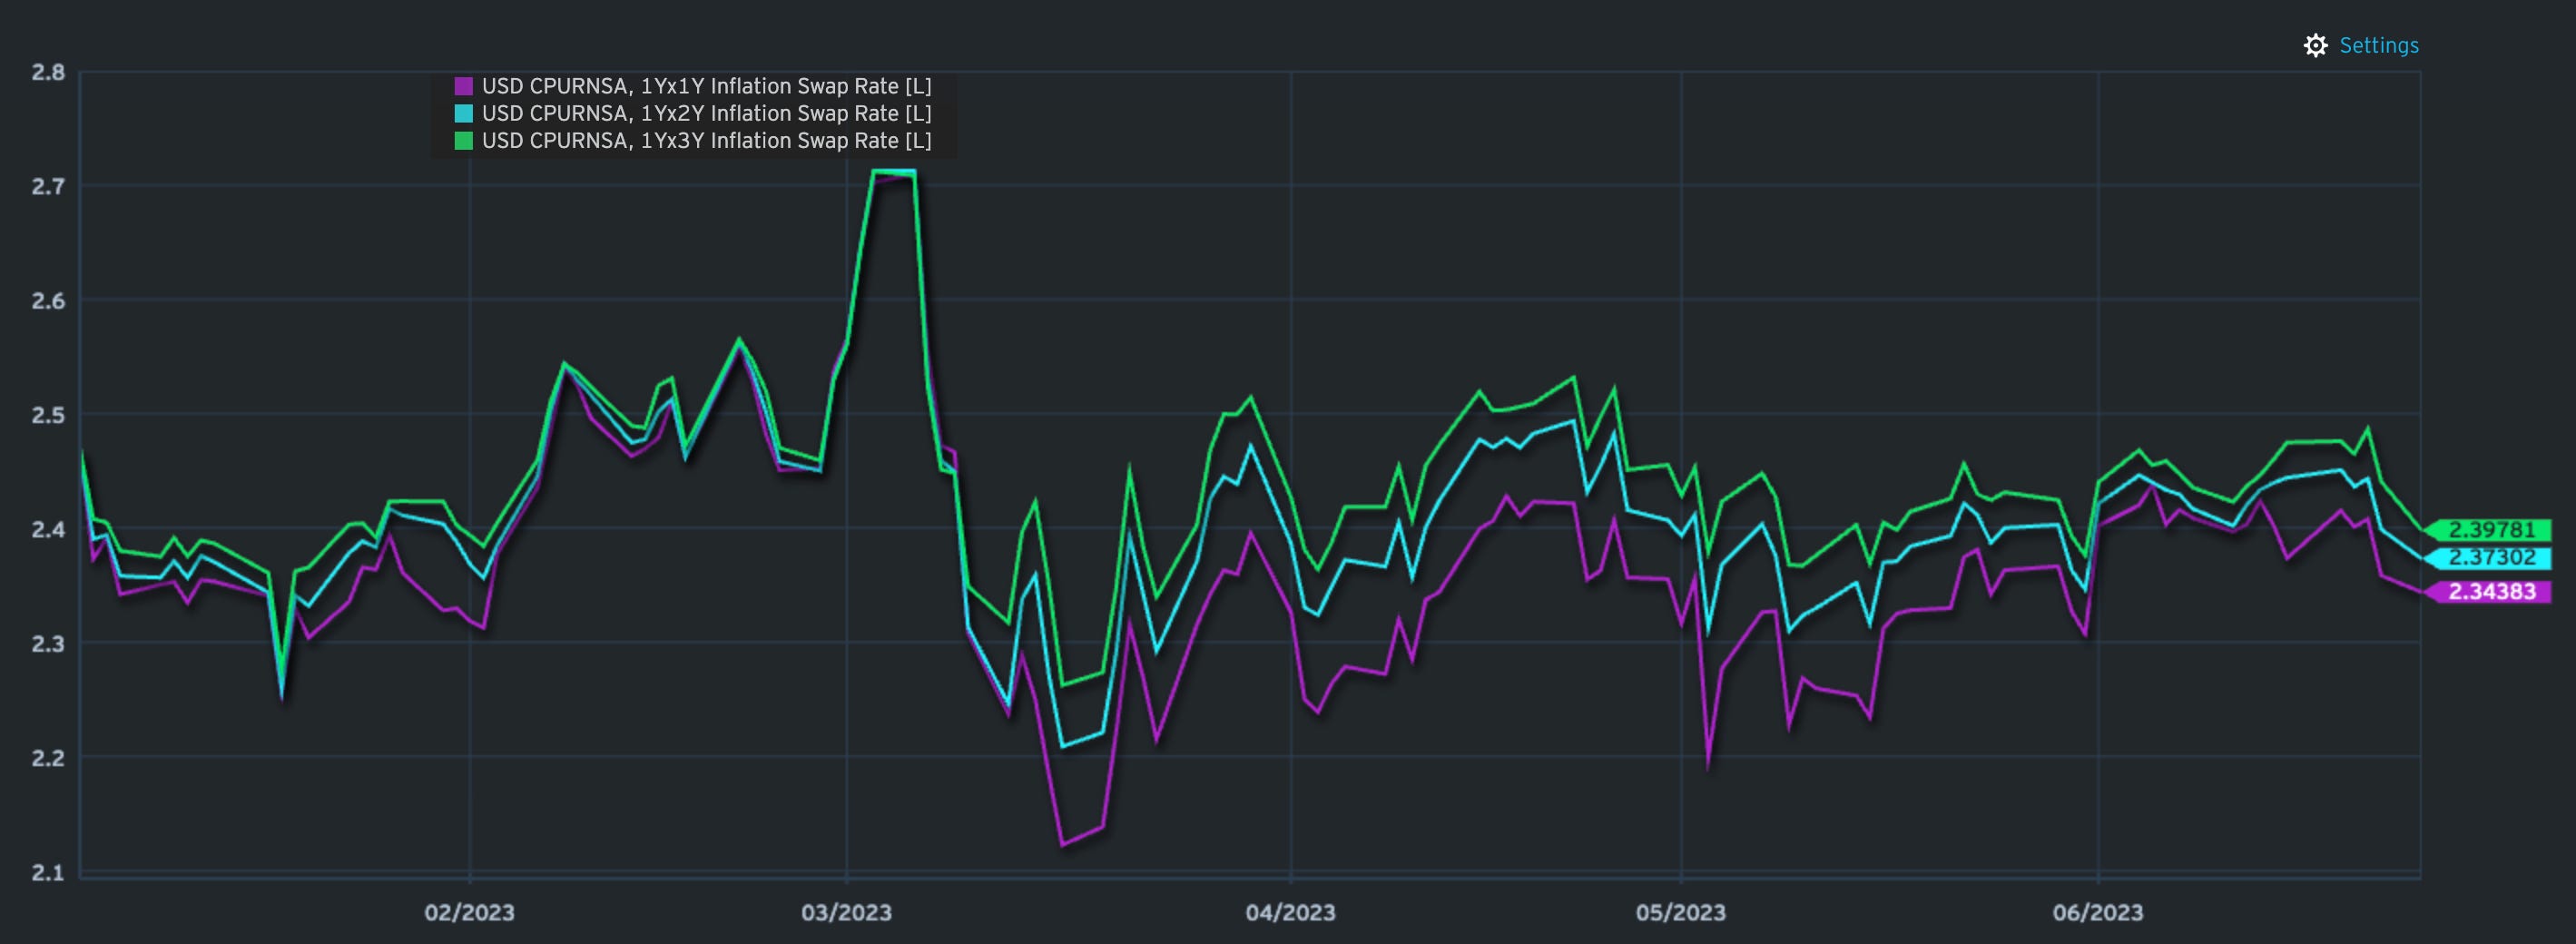
This is also in line with Breakeven inflation rates & Inflation Swaps (CPI) which are all pointing towards closing in on the Fed’s 2% target over the next few years.

Also, when looking at the Dec-23 / Dec-24 spread of 147 bps (see above) you can conclude that given the Fed’s still in favour of hiking at least twice (so they say) the spread could be wider than that as more hikes lead to an even more aggressive cutting cycle.
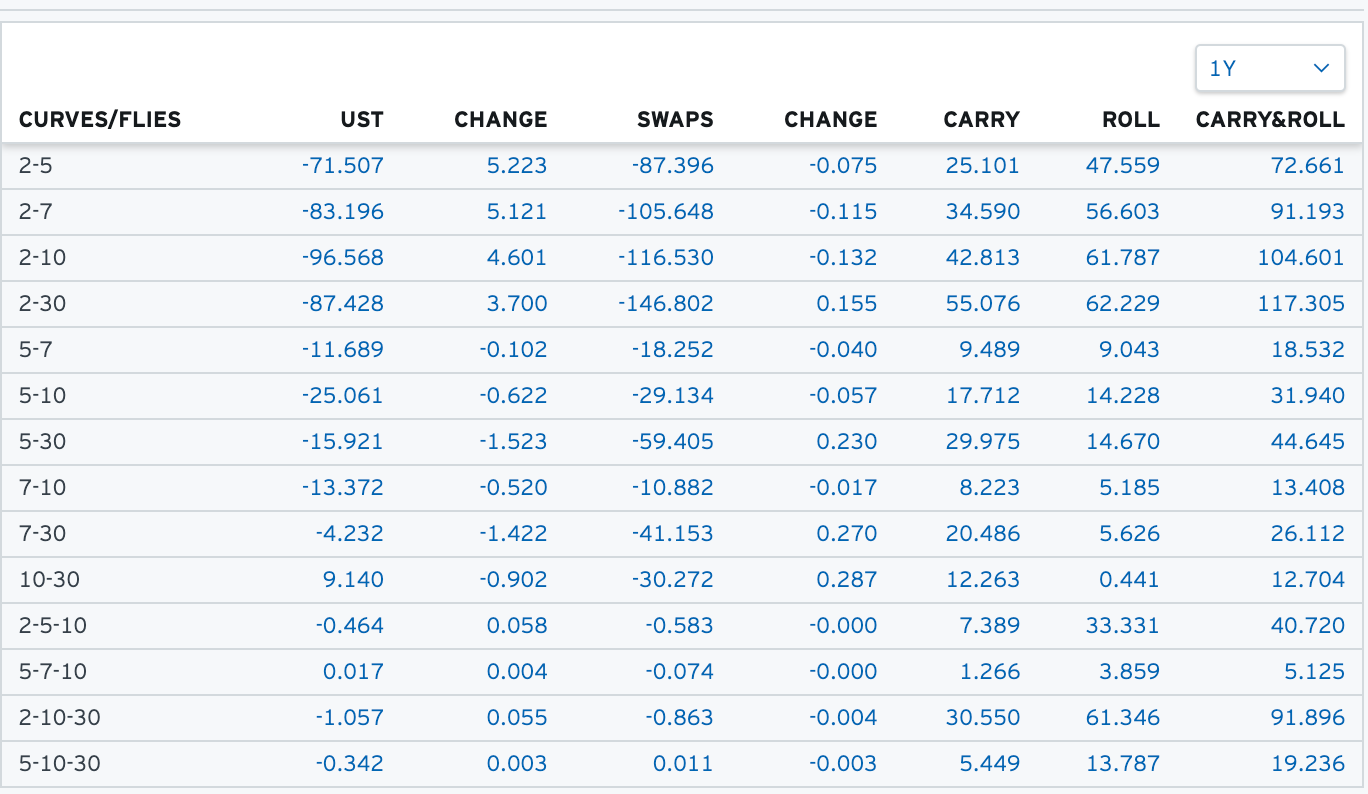
As for the general Treasury curve, the obvious trade implementation are steepeners. Now, beware of just entering those trades as carry/roll will make it painful for this trade until the moment we start moving. Timing is everything. As a refresher, look at some of my Trading the Yield Curve posts. Below you will find the current carry/roll for your favourite US treasury curve trades.
As an example, carrying 2-10s steepeners for a year will cost you roughly 105 bps, or in other words, the curve needs to steepen by more than that just for you to start making money on the trade.
As mentioned in Series 1 of “When to Buy Bonds”, you can usually comfortably wait until the Fed is in play and has turned dovish. This is especially the case for the 2-year which is pinned by the Fed’s current reaction function. Usually, the 2-year will not move until a few weeks ahead of the Fed’s first cut. Similarly, shorting 10s (the short leg of a 2-10s steepener) also doesn’t make much sense at the current juncture. Maybe it’s worthwhile playing the trade further out by buying 3-year treasuries vs. 5-year (see chart below). You can then use the 10-year point to add duration when needed.

Overall there is no real magic bullet when it comes to bonds. They usually work well as diversifier unless you’re in an inflationary regime. It comes down to your assessment of the likely future reaction function and in the current case how quickly inflation can drop back to a more reasonable level.
Given the overall tightening already incurred as well as the historic pretext of something usually breaking I find it relatively attractive to now think past the next few Fed rate hikes and see for where things can settle 1 and 2 years out. It is hard to absolutely hate bonds where they are. Yes, I’d ideally like a 4-handle on my longer-dated US Treasuries but it’s probably wise to start with a small allocation where we are. Should my assessment above prove right, it should hit a nice return over the next 24 months or so.
What can wrong? Plenty of things and also things that are currently not on the horizon. Inflation might prove stickier than thought and even reverse higher. The Fed might be pushed to hike even further and once 6% rates are considered all bullish bond bets are certainly off. This is very much non-consensus but don’t carry a zero probability for me, more like a 15% likelihood. As in all things, being nimble and anticipating the needed catalysts for your trade to work are of utmost importance.
Keep in mind, this is by no means advice. I am merely outlining a reasonably bullish case for bonds which might or might not materialise.
Hope you find this useful
Your,
Paper Alfa
This is very helpful. Could you maybe do an explainer on your carry & roll dashboard for the yieldcurve trades. I have no problem figuering out carry but how do you calculate roll costs?
Thank you very much for your work.