

Mid-Week Update
Post-CPI

US CPI gave us plenty to ponder about, with headline and core printing above consensus, with around 5 basis points of the overshoot in the core due to an unexpected 0.56% leap in owners’ equivalent rent, the biggest increase since last April. However, this is unlikely to persist given the downtrend in primary rent inflation, tracking the plunge in Zillow's private sector rent numbers. Meanwhile, the core reading was also unexpectedly boosted by a 1.6% leap in hospital services prices.
Unsurprisingly, the number put a dent in the prevalent soft-landing scenario. Now, one print doesn’t change the direction, but it has certainly raised questions. It will be interesting to see how markets follow through from here.
Inflation swaps have certainly taken note; see the chart below. The actual CPI curve is the pink line, the green one from 3 months ago and the orange line from last week. While the longer-dated structure didn’t adjust much, the near-term path for inflation is now becoming less certain, given the unknown time lag of some of the components and their ultimate impact on inflation going forward.

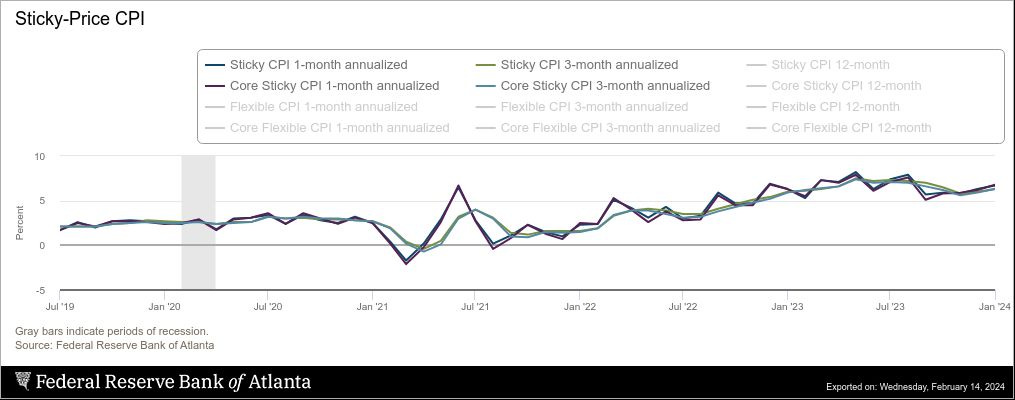
This isn’t great news for the Fed, with their preferred core ex-services measure annualising above 10% again. The Atlanta Fed’s sticky measures (see below) are also seeing a bit of a trend reversal, with the 1-month and 3-month annualised figures accelerating back to a 6%-handle pace.
I can easily paint a scenario where another print or two could severely question the current narrative and force the Fed to hold back on its easing plan. Only a month ago, markets had close to 170 bps off cuts priced (vs. the Fed’s 75). This has now dwindled to 95 bps. Where would markets trade in 3 months’ time when we are still trading with 3-number for CPI? One thing is to push rate hikes further out, but an entirely new regime would open up if we would have to abandon the idea of an easing cycle entirely. It's not my base-case scenario, but I’d give it a 15% probability.
Let’s now look at how the charts have responded. The momentum model took us short bonds a few weeks back, and those who have the TradingView scripts would have seen that the reversal model had a sell signal on the ES yesterday morning.
Let’s go.
