Mid-Week Update
July 3, 2024
A holiday-shortened week will have to deal with a few data points over the coming days, most importantly, US labour data. The backup in yields since Friday has caught many people off guard. The corresponding yield curve steepening also acted wake-up call to those collecting relatively attractive carry on flatteners. Some of the rallies were reversed on Tuesday amidst Powell’s ECB conference comments stating that prices are showing signs of resuming the disinflation trend. After we almost touched 4.5% on US 10s on Monday’s weak showing, we have now moved back to 4.43%.
The momentum model is now tempted to go long yields (short bonds) while we also have a reversal window opening up (yellow candle). This feels and acts more like a range trade, however, so I would be cautious in chasing things. I am erring more in trusting the reversal model in this environment, so we are probably looking at a mild reversal following the 15-20 bps backup in yields.
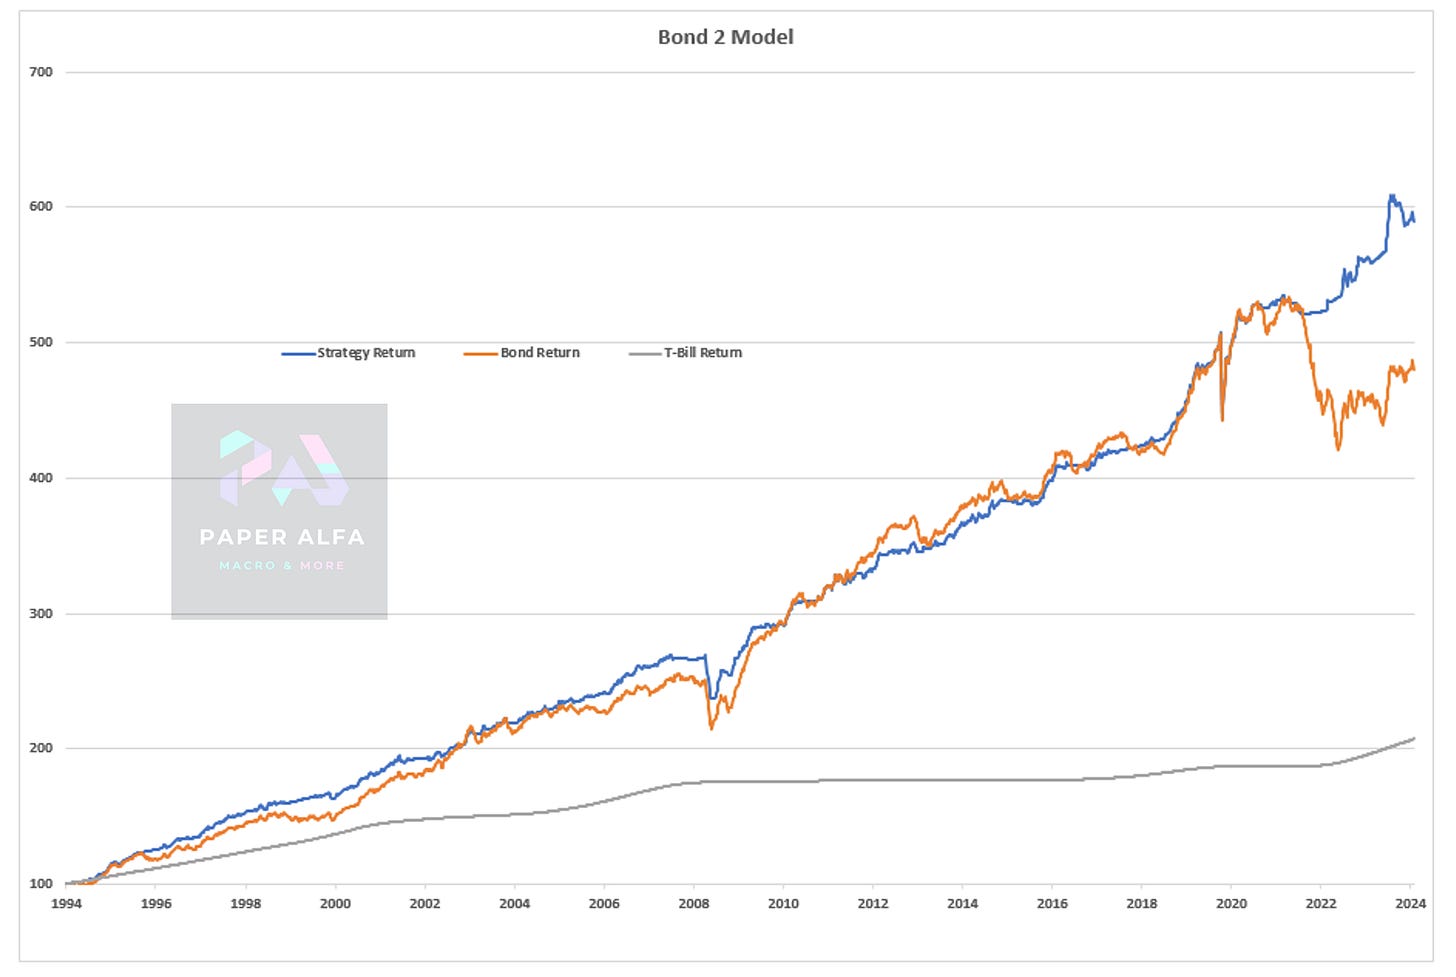
Given the relatively noisy bond market, I thought it would be great to refresh the bond models and see what they are highlighting. They have been on and off this year so far, running longs in bonds only roughly a third of the time. The Bond 1 model is currently flat, while the Bond 2 model is currently long Treasuries.
For those new to them, please see a refresher and explainer here.
As for visualisation, you see below the total return bond 1 model strategy vs the selected bond index since 1987. Remember, the goal is to perform but avoid larger drawdowns such as the one in 2022.
This drawdown histogram highlights the way more attractive drawdown profile quite nicely.
A similar picture ensues for Bond Model 2, which, on a total return basis, also outperforms the selected bond index by quite a margin while also avoiding larger drawdowns.
Highlighting the attractive drawdown profile below.
What about equities? I have presented a liquidity model in our Macroscope series, where I introduced a simple equity model, which has outperformed the SPX by quite a margin since the 1960s while also presenting a very attractive drawdown profile.
Currently, the model is flat equities. Similar to bonds, it has run about a third of the time in equities YTD. This obviously means giving up on some upside gains, but the fact that it’s not fully invested in this run-up should be telling. To me, this indicates a multiple expansion beyond the fundamentals of liquidity and earnings accumulation. Remember, this model wants to participate on the upside but not at the cost of getting exposed in larger drawdowns. It is hesitant to be long at the current juncture.
I am in the process of running the same liquidity methodology across a set of global equities. This will hopefully be available to subscribers very soon.
Let’s now turn to Macro D and his latest thoughts before we explore some chart updates. I’m also including a H2 macro calendar.


