

Friday Paper Round
May 26, 2023

Happy Friday! It’s been quite the week as we are finally breaking from the previous month’s hibernation mode. Things are moving somewhat unexpectedly as bond yields are tracking higher as the inflation stickiness is being re-evaluated. Meanwhile, stocks are holding their ground better than expected while the USD has found some renewed energy.
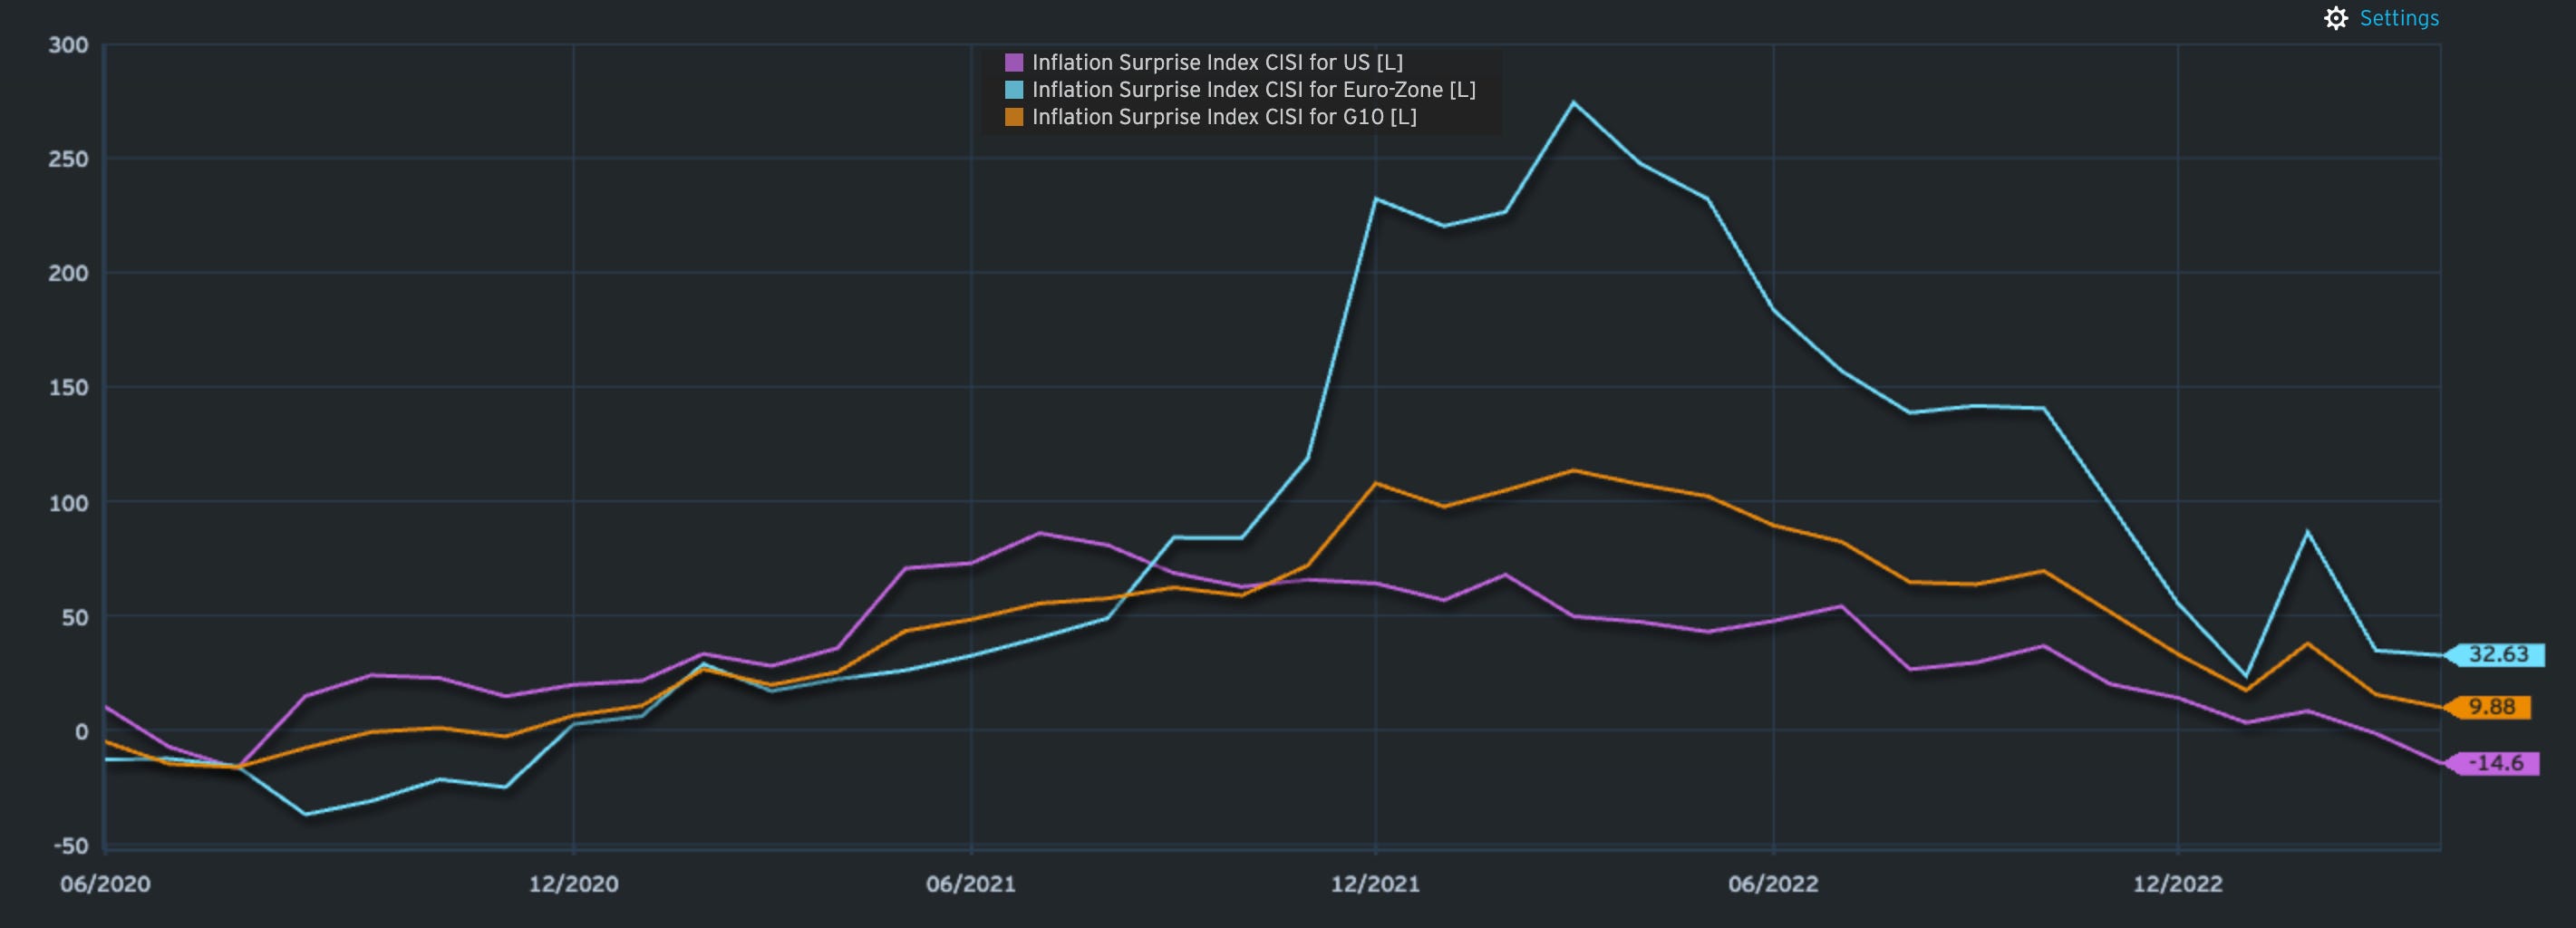
Looking at Citi’s eco surprise indices would reveal a somewhat lacklustre growth outlook for the US / Eurozone and G-10 in general. In fact, the US seems relatively resilient so far.

Turning to inflation surprises, the trajectory has been a steady fall from about a year ago. This chart, however, does not cater for this month’s releases in inflation which have surprised to the upside.
This has been the main culprit in the reassessment of near-term rate hike probabilities as well as the stickiness of inflation and hence the medium-term path towards the somewhat elusive 2% mark.
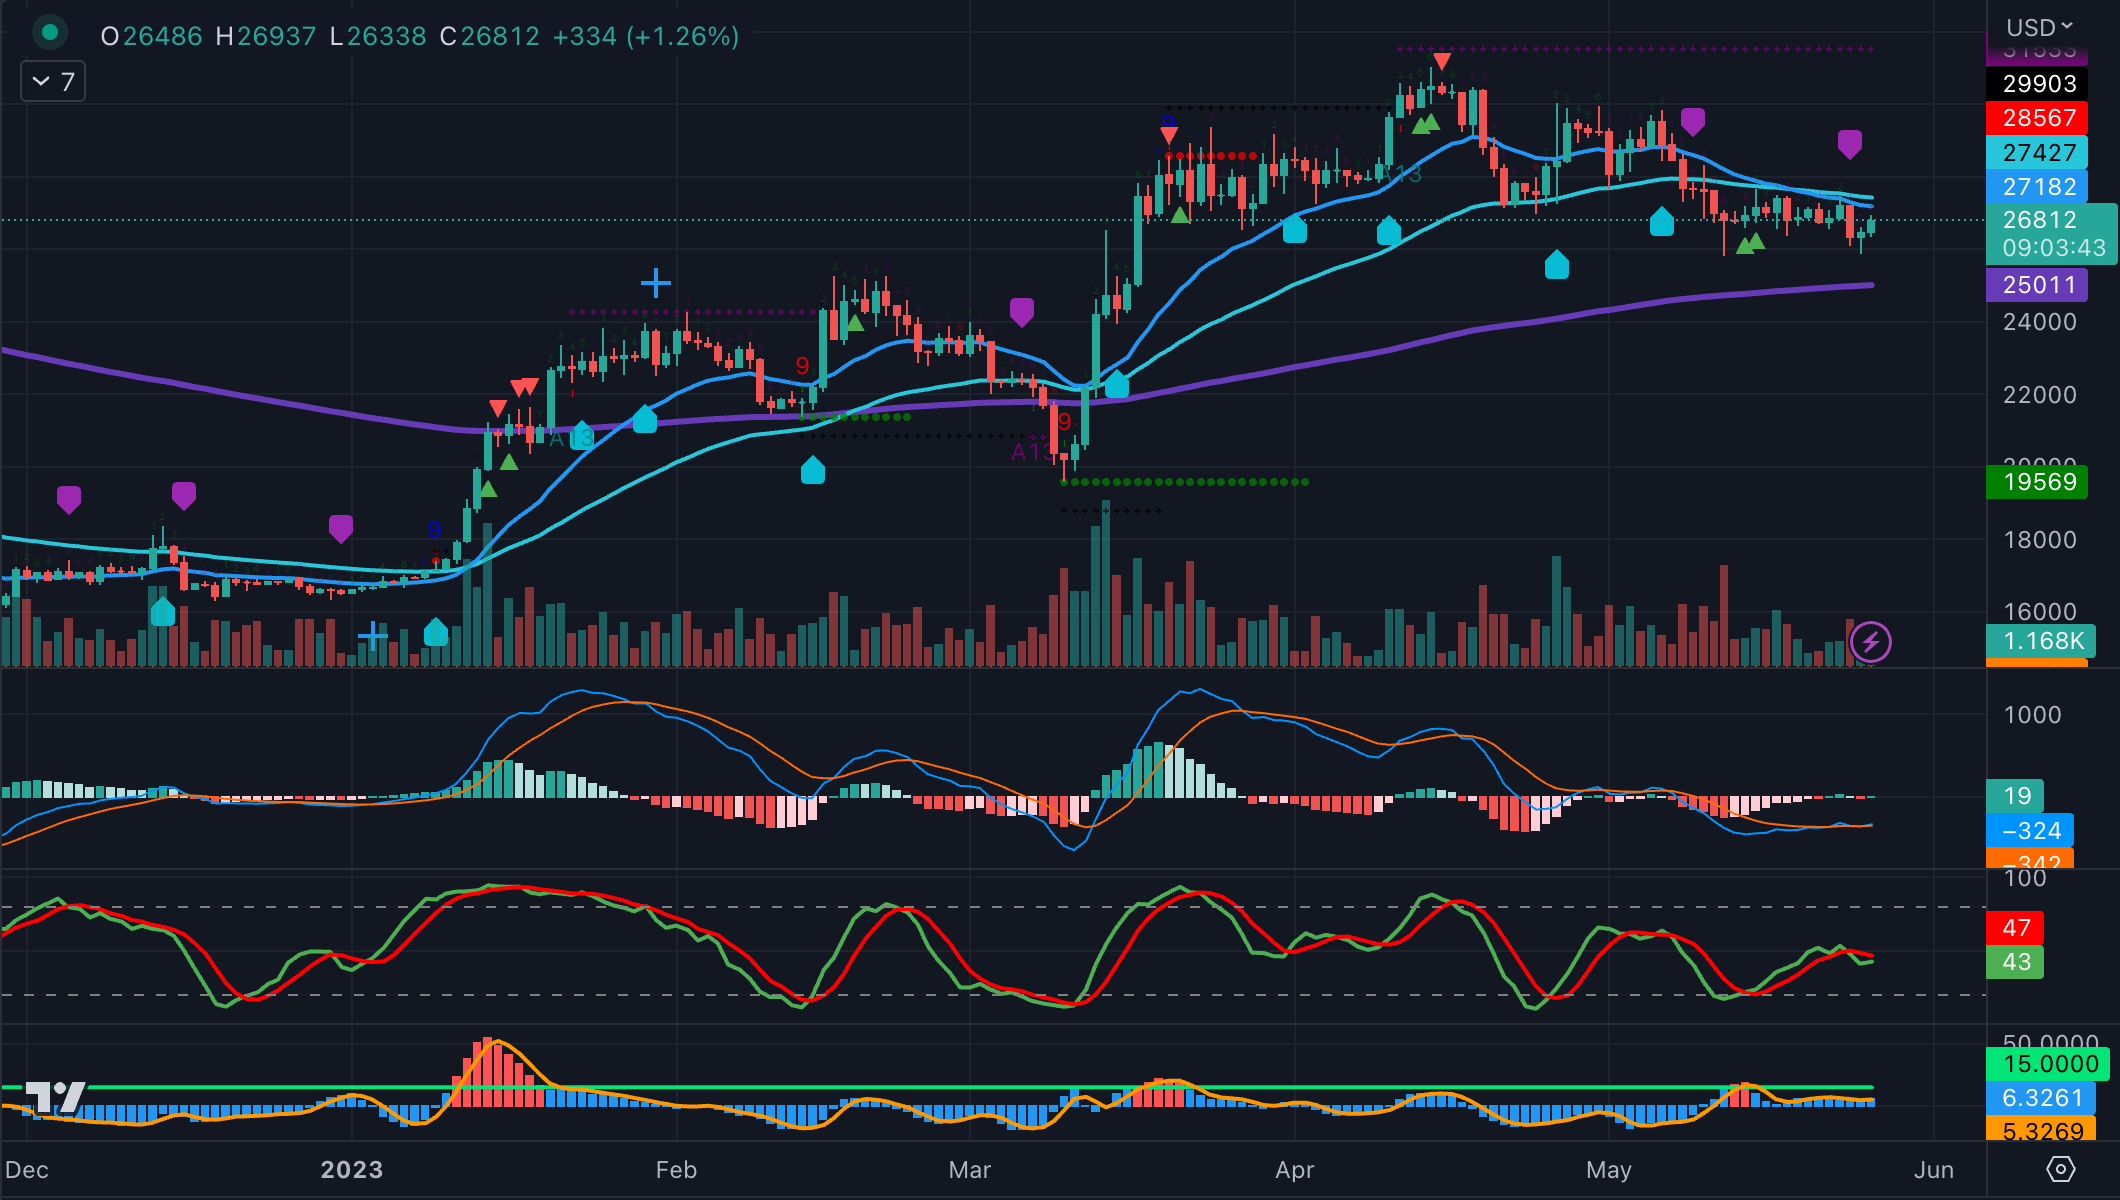
Now let’s turn to what the good old charts are saying. Let’s go straight at it.
ES, the overbought flag worked well and triggered the model to take profit for the long it had since the end of March. We are now awaiting the next signal.

NQ, meanwhile, has equally demonstrated a very short retracement which was well-flagged by the model. As outlined in last week’s assessment, exhaustion signals like this one do not typically negate the prevailing trend. The model is still long.

Russell, a stark contrast to its two US compadres above. The model is short although it has just flipped from a recent buy signal. Choppiness at its best. To be there is no clear direction for now.

DAX, has a similar pattern to the S&P 500 in that the model closed its long on the overbought reversal. Now that we have tested the 50-day line on two occasions, odds are we will resume the uptrend in my opinion.

NIKKEI, again shows a nice move from overbought level retracements just to resume its upward trend. The model has played along and remains a firm buyer.

Hang Seng, is showing further weakness with the model holding its short. Oversold levels are flashing which could set up a nice bounce from key support levels.

2-year US future, vicious selling and the model has done well in capturing the down move. We now have oversold levels flashing, indicating a good chance for a bounce.

Ultra-Future, all other maturities are exhibiting similar oversold patterns for a likely bounce. The most pronounced being the long end of the US curve.
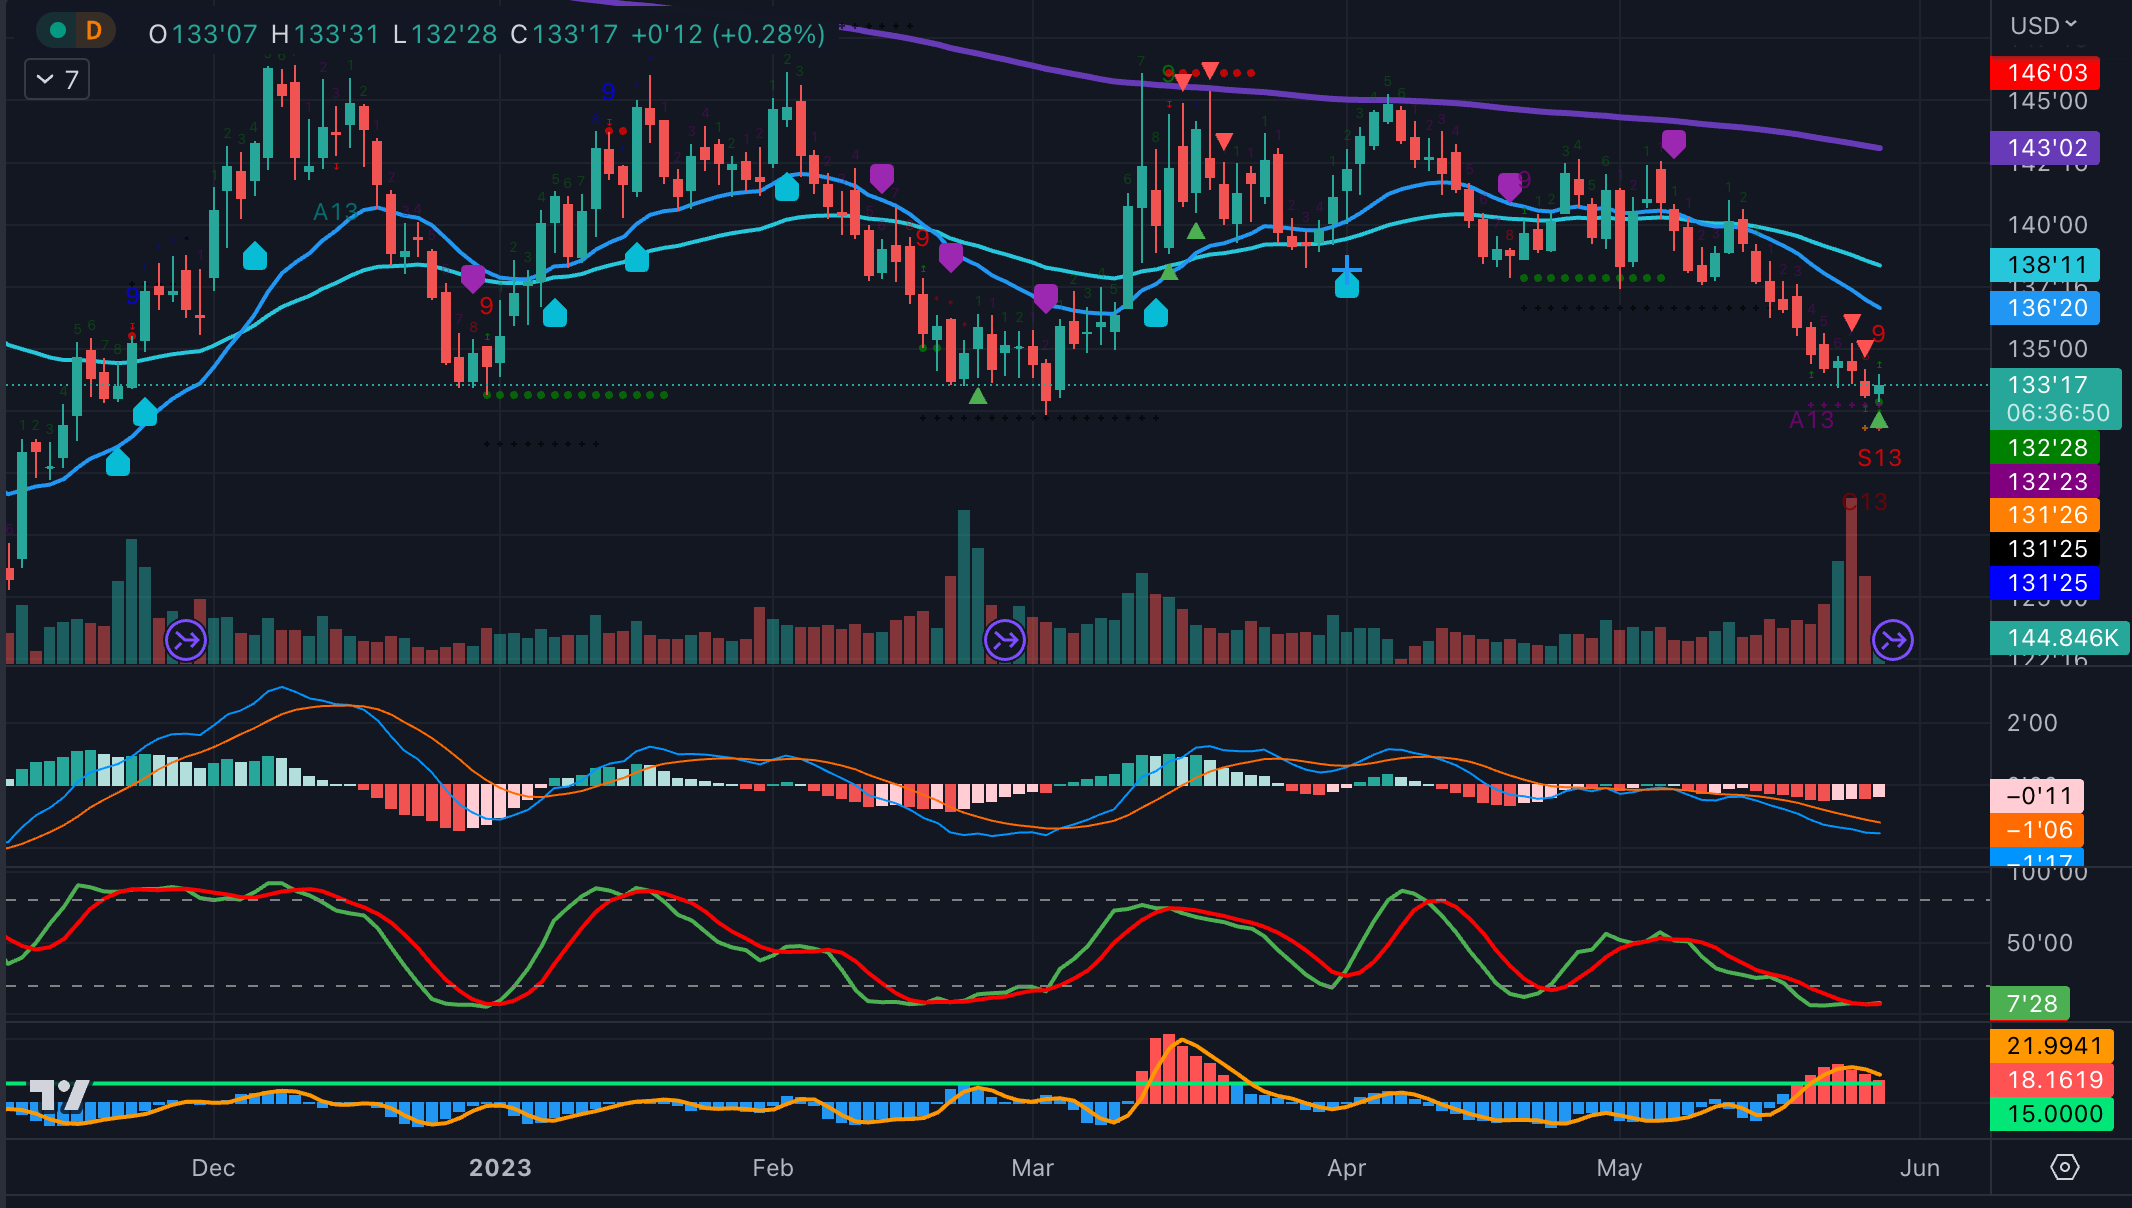
US 2-10s curve continues the flattening trend. We are now at levels pre-SBV blowout.

US 5-30s has also shot past the 200-day line. Unsurprising as all inflation dynamics have been testing near-term rate expectations.

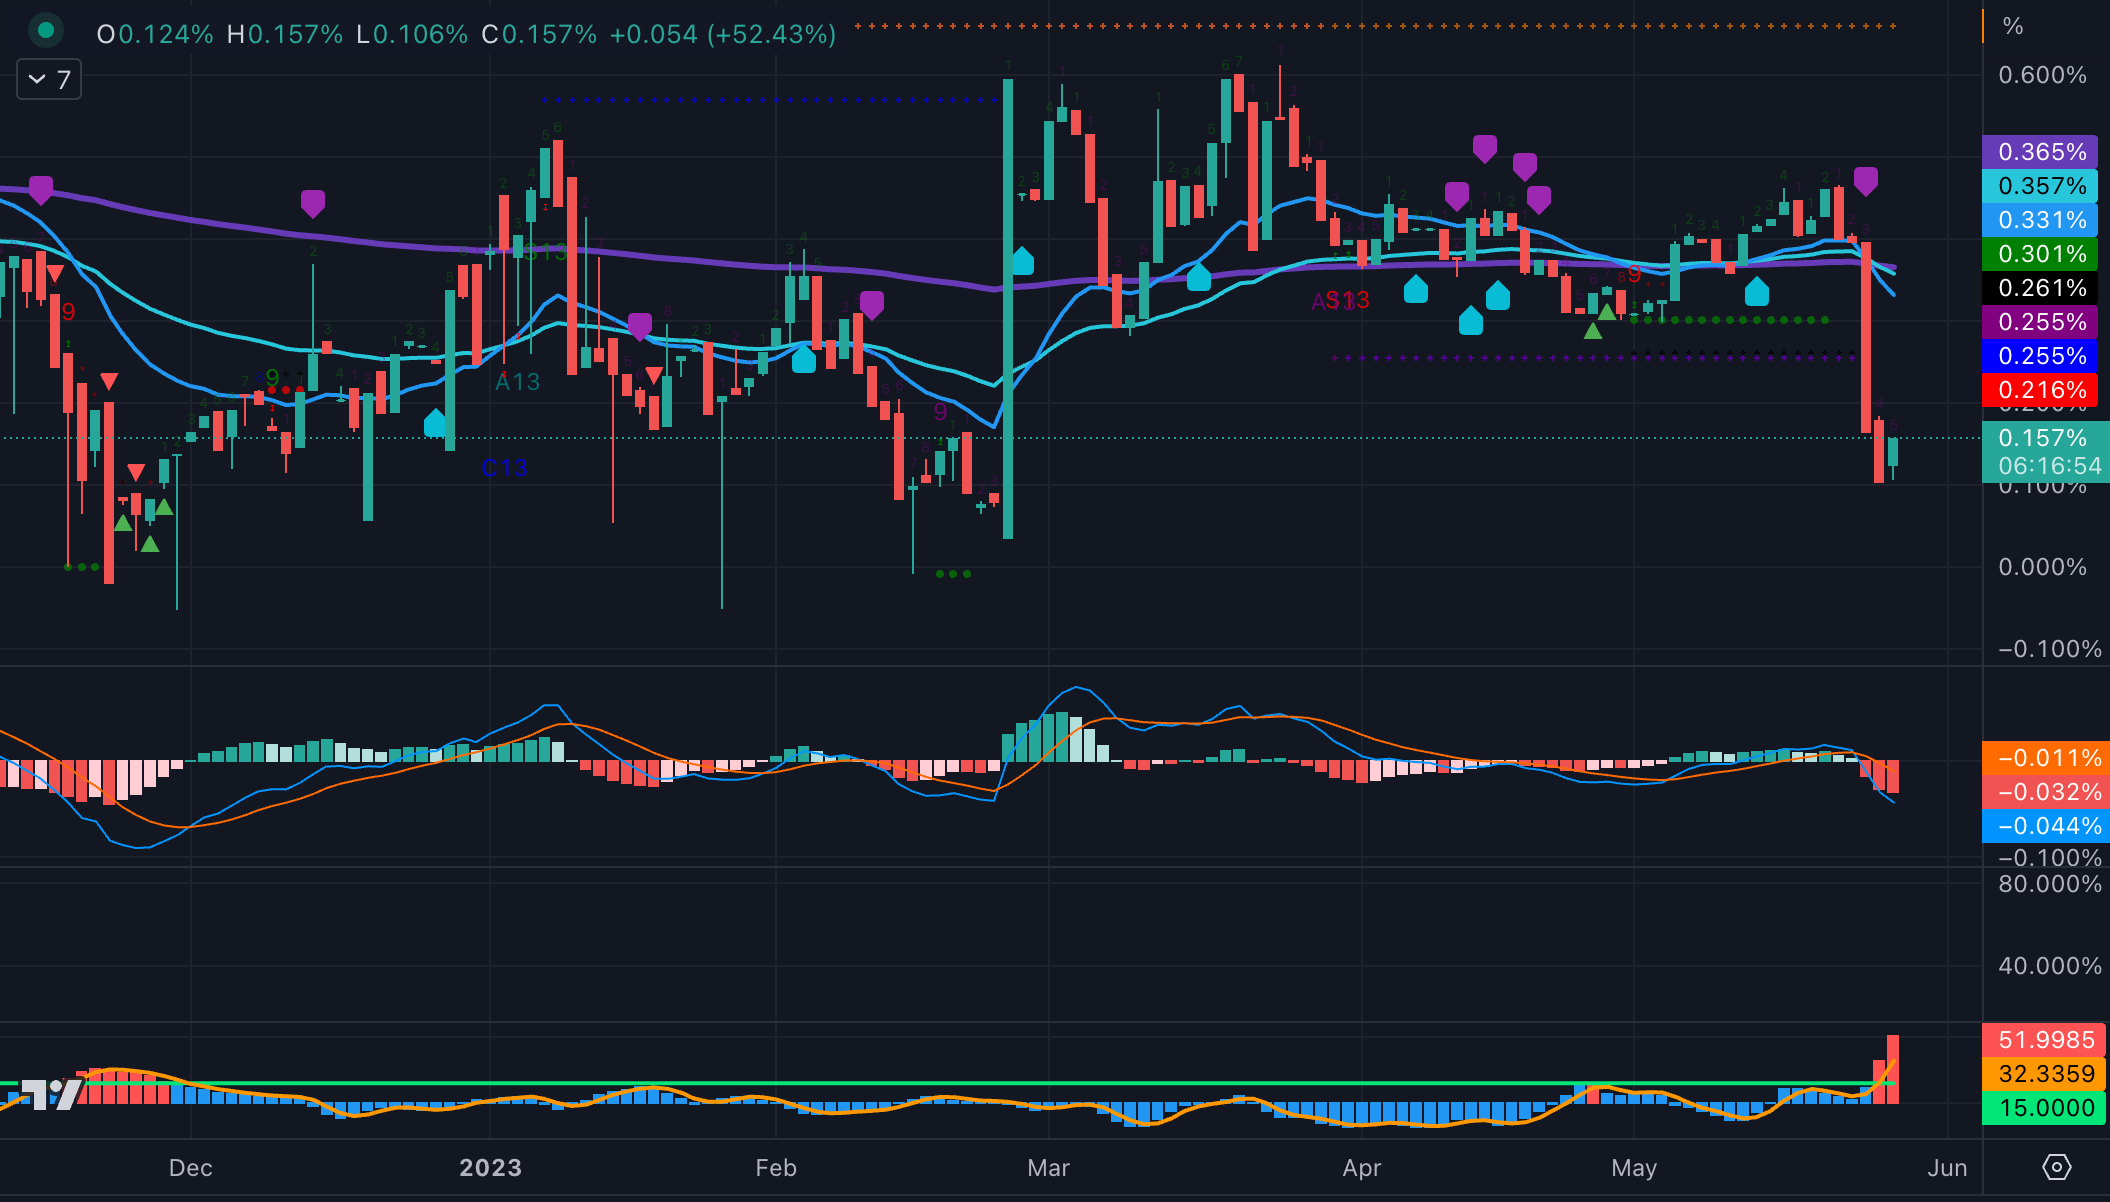
Gilts, oh boy. The model is still showing a short but the oversold signals have been flashing all week without a bounce. Core inflation surprised and caught many off guard. This is starting to look more like an emerging market.

The big flattening in UK 2-30’s however would suggest just a re-pricing of rate expectations for now. BoE’s hand will be forced. Mortgage lenders have already adjusted the rates higher this week.
JGB’s, meanwhile, are surprisingly undisturbed by the gyrations of their global counterparts.

… with the exit valve naturally finding its way through the FX market. USD/JPY. The model sold nicely and still holds its position.

General Dollar strength is also visible across other crosses. EUR/USD is no different. The model added to its short and now we are toying with the 200-day line.

The often-used risk barometer in FX, AUD/JPY, has an interesting development in that the model closed its long. Note how it’s struggling to break below the 200-day average.

Gold, the model triggered another sell signal although it is fighting a tentative reversal signal today.

Silver, meanwhile, also on a model short has bounced nicely on the 200-day line.
BTC/USD, has been relatively muted compared to other markets. As a liquidity proxy, it is less prone to inflation and rate dynamics although its correlation to higher beta equity indices would suggest the model to be long, it is not, the model initiated its second short.
ETH/USD, has the same dynamics as big brother BTC and the model also like to keep a short.

So all in all, risk assets are resilient and the frustration of many bears I am sure. Rates are getting whacked but look ripe for a relief rally soon.
Hope you are enjoying those charts. Please send your comments and suggestions which is always highly appreciated.
I had people ask why those signals are not being used in a portfolio context which then could be tracked. Do not worry, Paper is working on exactly that, so stay tuned.
The goal, in the first instance, was to give my followers a look into the dynamics so that they can familiarise themselves with how fast and slow the model reacts to certain changes.
Your
Paper Alfa
Music
Yesterday, I had the pleasure to see a great upcoming artist in the amazing Royal Albert Hall. Cleo Sol. Give her a listen.
Here is one of her many great tunes:
Do you post updates to the models daily?
Do know your writings are appreciated and I anticipate your portfolio context. I note USD is on the upswing and wonder if you are an adherent of the dollar wrecking ball theory.
Cleo Sol has promise and elicits fond memories of Kensington which is my preferred base in London. Last there on a 3 day theatre weekend and saw Jerry Springer The Opera-likely not Kitty appoved! Cannot forget the refrain: dip me in chocolate and throw me to the lesbians.
Truly enjoyed Dust Bowl III and would note that more egregious than Will's death was Eli's deletion of Will's voicemail message.
A haunting old fave: https://www.youtube.com/watch?v=Eo-UKCxCglg