Friday Paper Charts
April 4, 2023
I am travelling and on my way to the beautiful British coast, moving from rain into more rain. So, today’s charts are all as of the close of business Thursday.
It has been quite a week; finally, there is some movement. I would recommend you read my pieces from earlier this week, which highlight my current thinking.
ATW: Read my thoughts about the implications of the BoJ’s YCC change. This has possibly added to the long-end woes this week.
A timely piece on Bond Futures and its mechanics.
Lastly, my bond market thoughts from Wednesday close.
Additionally, I am writing a thought piece on technical analysis with a special focus on equity markets. It lays out the framework as to how I philosophically arrived at the way I look at stock markets in general.
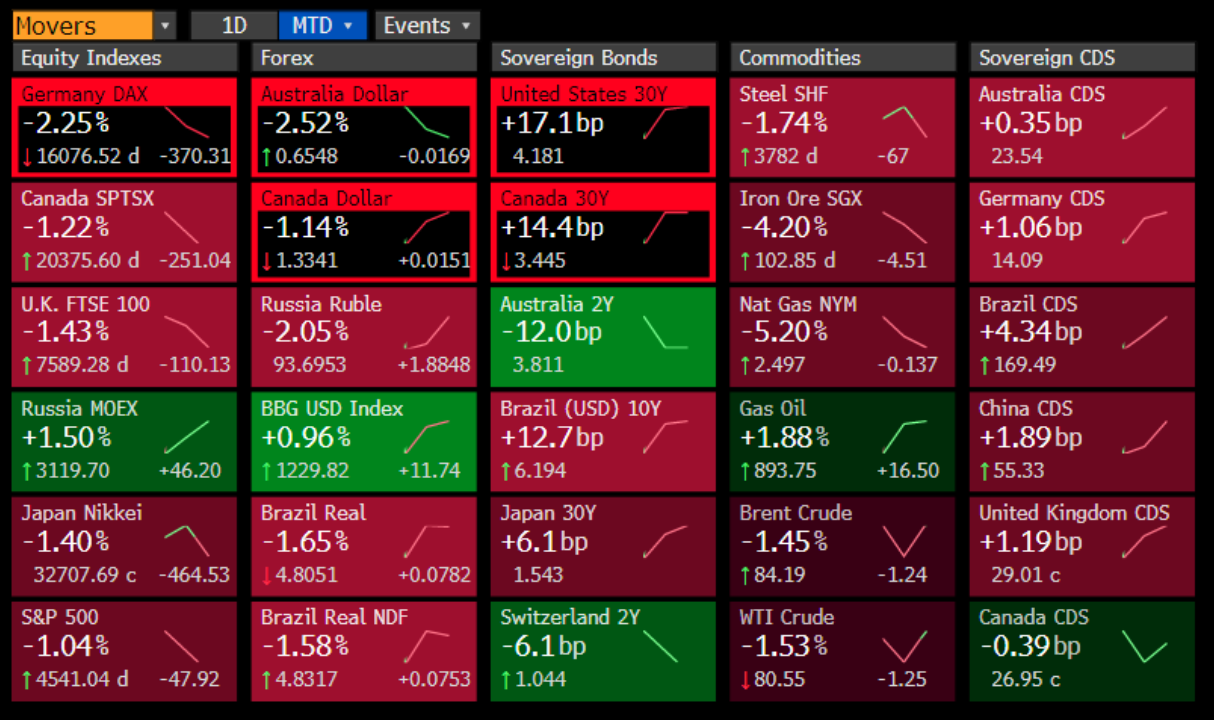
August tends to be seasonally a month of low conviction markets in general. So far this month, only the USD was a haven of refuge.
The Treasury announced slightly larger increases to coupon sizes than most expected. They also guided the market that there is more to come. Treasury’s financing estimates, released on Monday, surprised to the upside, but most seem sceptical that T-bill issuance will realize that high. Separately, the Treasury guided to a higher TGA balance which implies more liquidity drain.
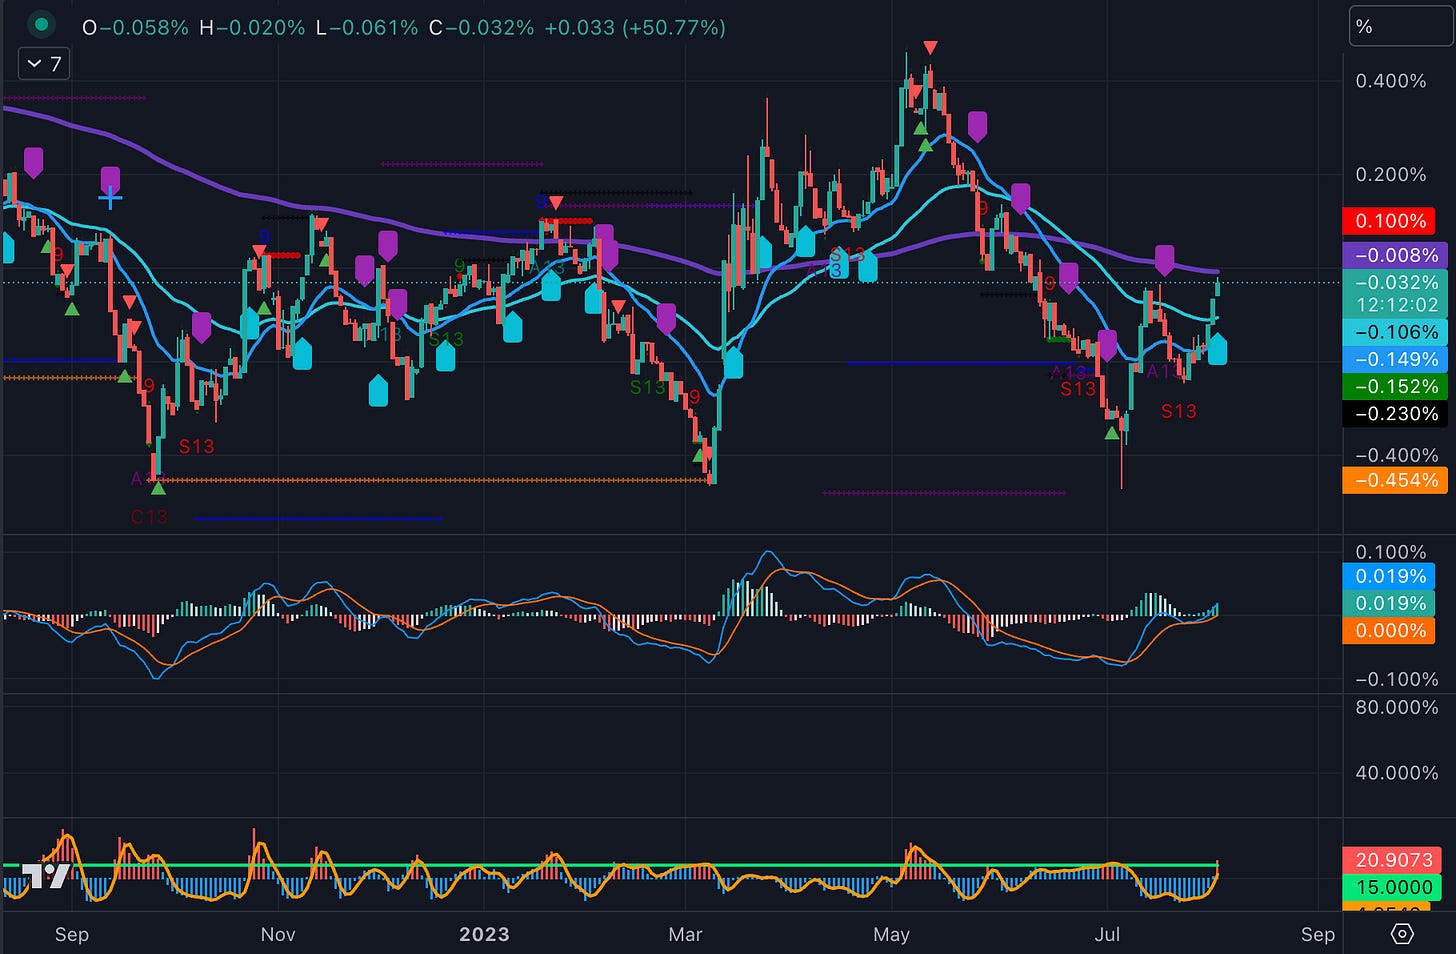
US 5-30s (Paper’s favourite steepener) is approaching the 200-day line. And we are just about flat on this curve alone.
Below is the ratio of the top 5 S&P 500 names versus the other 495 and a trend line. 10-year real yields are in the panel below. I’d argue a healthy correction back to the trend line would be warranted, especially when you consider that there will be unlikely multiple expansions without earnings. Also, as the S&P 500 is a market cap-weighted benchmark, active managers have to underweight large caps to take active risks. In the first half of the year, active risk-cutting resulted in managers buying mega-cap tech.
Let’s dig into the rest of the charts.


