

Attack the Week (ATW)
Shock Dynamics / Weekly Calendar / Chart Dashboard / Asset Allocation Model

Sunday Thoughts - Shock Dynamics
Another turbulent weekend. The kind that strips away noise and forces you back to first principles. So this week I want to go deeper — not just on what is happening in markets, but on the nature of shocks themselves. How they form, how they are modelled, and — the question that matters most right now — whether normalisation is a certainty or an assumption we have borrowed on credit.
Let’s start with physics.
A shock wave is a discontinuity. A point at which pressure, density, and temperature change so abruptly that smooth mathematics breaks down. The medium ahead has no warning. No gradual hand-off. And on the other side of that front, the rules are fundamentally different.
What fascinates me is not the physics. It is the word. Discontinuity. A very specific mathematical claim: the function has no defined value at the point of transition. You cannot model through it. You model around it — or accept that your framework has, for a moment, failed.
The physics: Rankine-Hugoniot
Shocks were formalised in the 19th century by Rankine and Hugoniot. Their insight: across any shock front, mass, momentum, and energy are conserved — but the post-shock state is permanently different. The diagram below shows this in the pressure-volume plane. The Hugoniot curve traces every possible post-shock state. The isentrope is the smooth, reversible path that would have existed in the absence of a shock. The gap between them is entropy — irreversibility baked in.
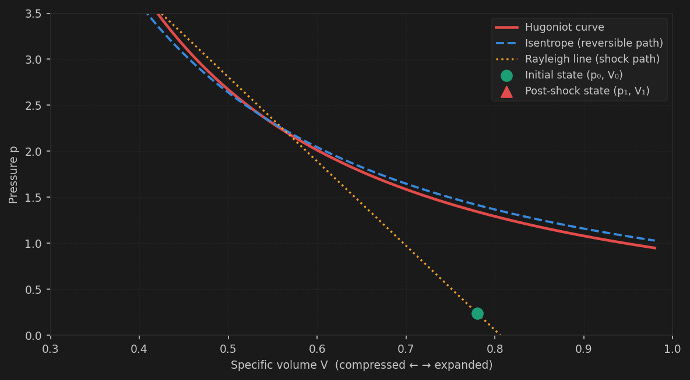
A weak shock barely moves you along the Hugoniot. A strong one jumps you to an entirely new region.
The question for oil markets is simple: does the financial Hugoniot curve circle back to where you started, or shoot you somewhere permanently new?
The Finance translation: Merton (1976)
Merton borrowed this logic directly. His jump-diffusion model separates markets into two regimes: continuous diffusion on normal days, punctuated by Poisson-distributed jumps of random size. The SDE is dS/S = (μ − λk̄)dt + σdW + JdN. The jump term JdN is the shock front. The model does not assume reversion. It accepts a new level, and diffusion resumes from there.
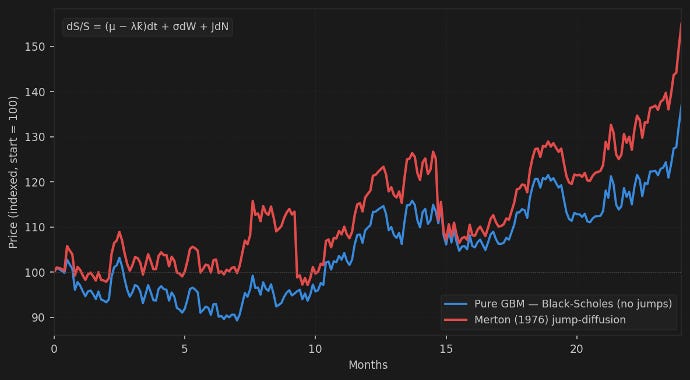
The blue line is the Black-Scholes world — frictionless, continuous. The red line is the world we live in. The gaps are not noise. Those are the moments when your framework fails, and your hedges save you.
Does everything revert? The half-life question
The dominant model for commodity prices is the Ornstein-Uhlenbeck process — the mathematical form of mean reversion. The pull towards the long-run mean happens at speed κ. The half-life of that reversion is t½ = ln(2)/κ.
Research on WTI and Brent spot prices found half-lives typically ranging from a few weeks to a few months — but roughly half of all historical sub-periods showed no statistically significant mean reversion. The model markets use to think about oil “normalising” only works half the time in the data.
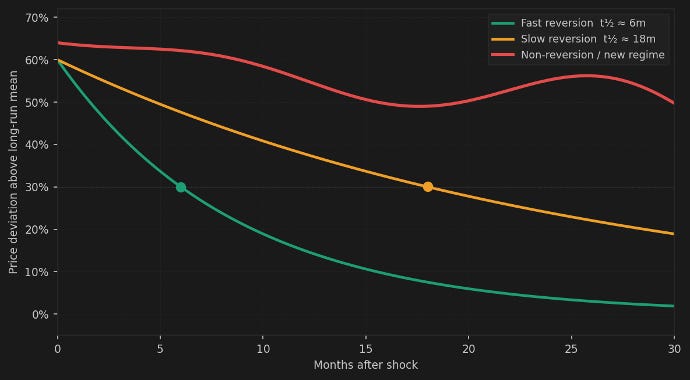
The three paths above represent the empirical range from the literature. The green path is a contained supply shock. Amber is a compound disruption. Red is the non-reverting scenario — a new regime. The word “shock” already assumes return. The data says that the assumption fails about half the time.
Not all shocks are alike: Kilian’s taxonomy
Lutz Kilian’s seminal 2009 paper decomposed oil price shocks into three structural types: supply disruptions, aggregate demand shocks, and precautionary demand shocks driven by fear. Each has a distinct impulse response and a different half-life. The compound shock combines all three — that is the current crisis profile.
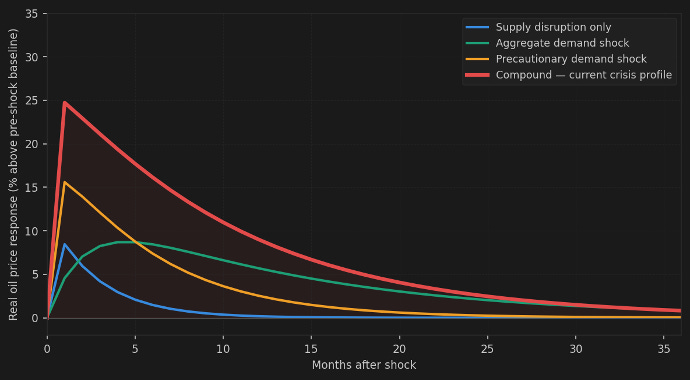
The red line is where we are. It sits above all three individual shock types in both peak magnitude and reversion duration. Markets pricing a 12-month normalisation are implicitly betting on the blue line. The data suggest that red is the more honest analogue for a Hormuz-closure scenario.
Are markets too relaxed?
Markets are pricing a shock they expect to resolve. The implicit mean-reversion prior baked into forward curves and options assumes we are in the post-peak oscillation band, with gravity pulling things back. That assumption has a reasonable historical base rate. But the compound nature of this shock — supply disruption, precautionary fear premium, and geopolitical structural shift — suggests the half-life is longer than most forward curves imply.
Where I land
Either we are at or near the apex — geopolitical exhaustion forcing resolution faster than markets expect — or this crisis is taking a different trajectory, one in which the supply disruption becomes structurally embedded and the Hugoniot does not circle back.
The losses in the inflation-first phase are timing costs, not directional errors. A portfolio built on hedges and convex payoffs survives both paths.
The shock front is precisely the zone that mathematics skips over. Your job is to still be standing on the other side of it.
Prepare and fear nothing. In preparation for several scenarios, I have identified three trades I am considering for the road ahead. One involves oil, one involves STIR rates, and one involves Macro FX.
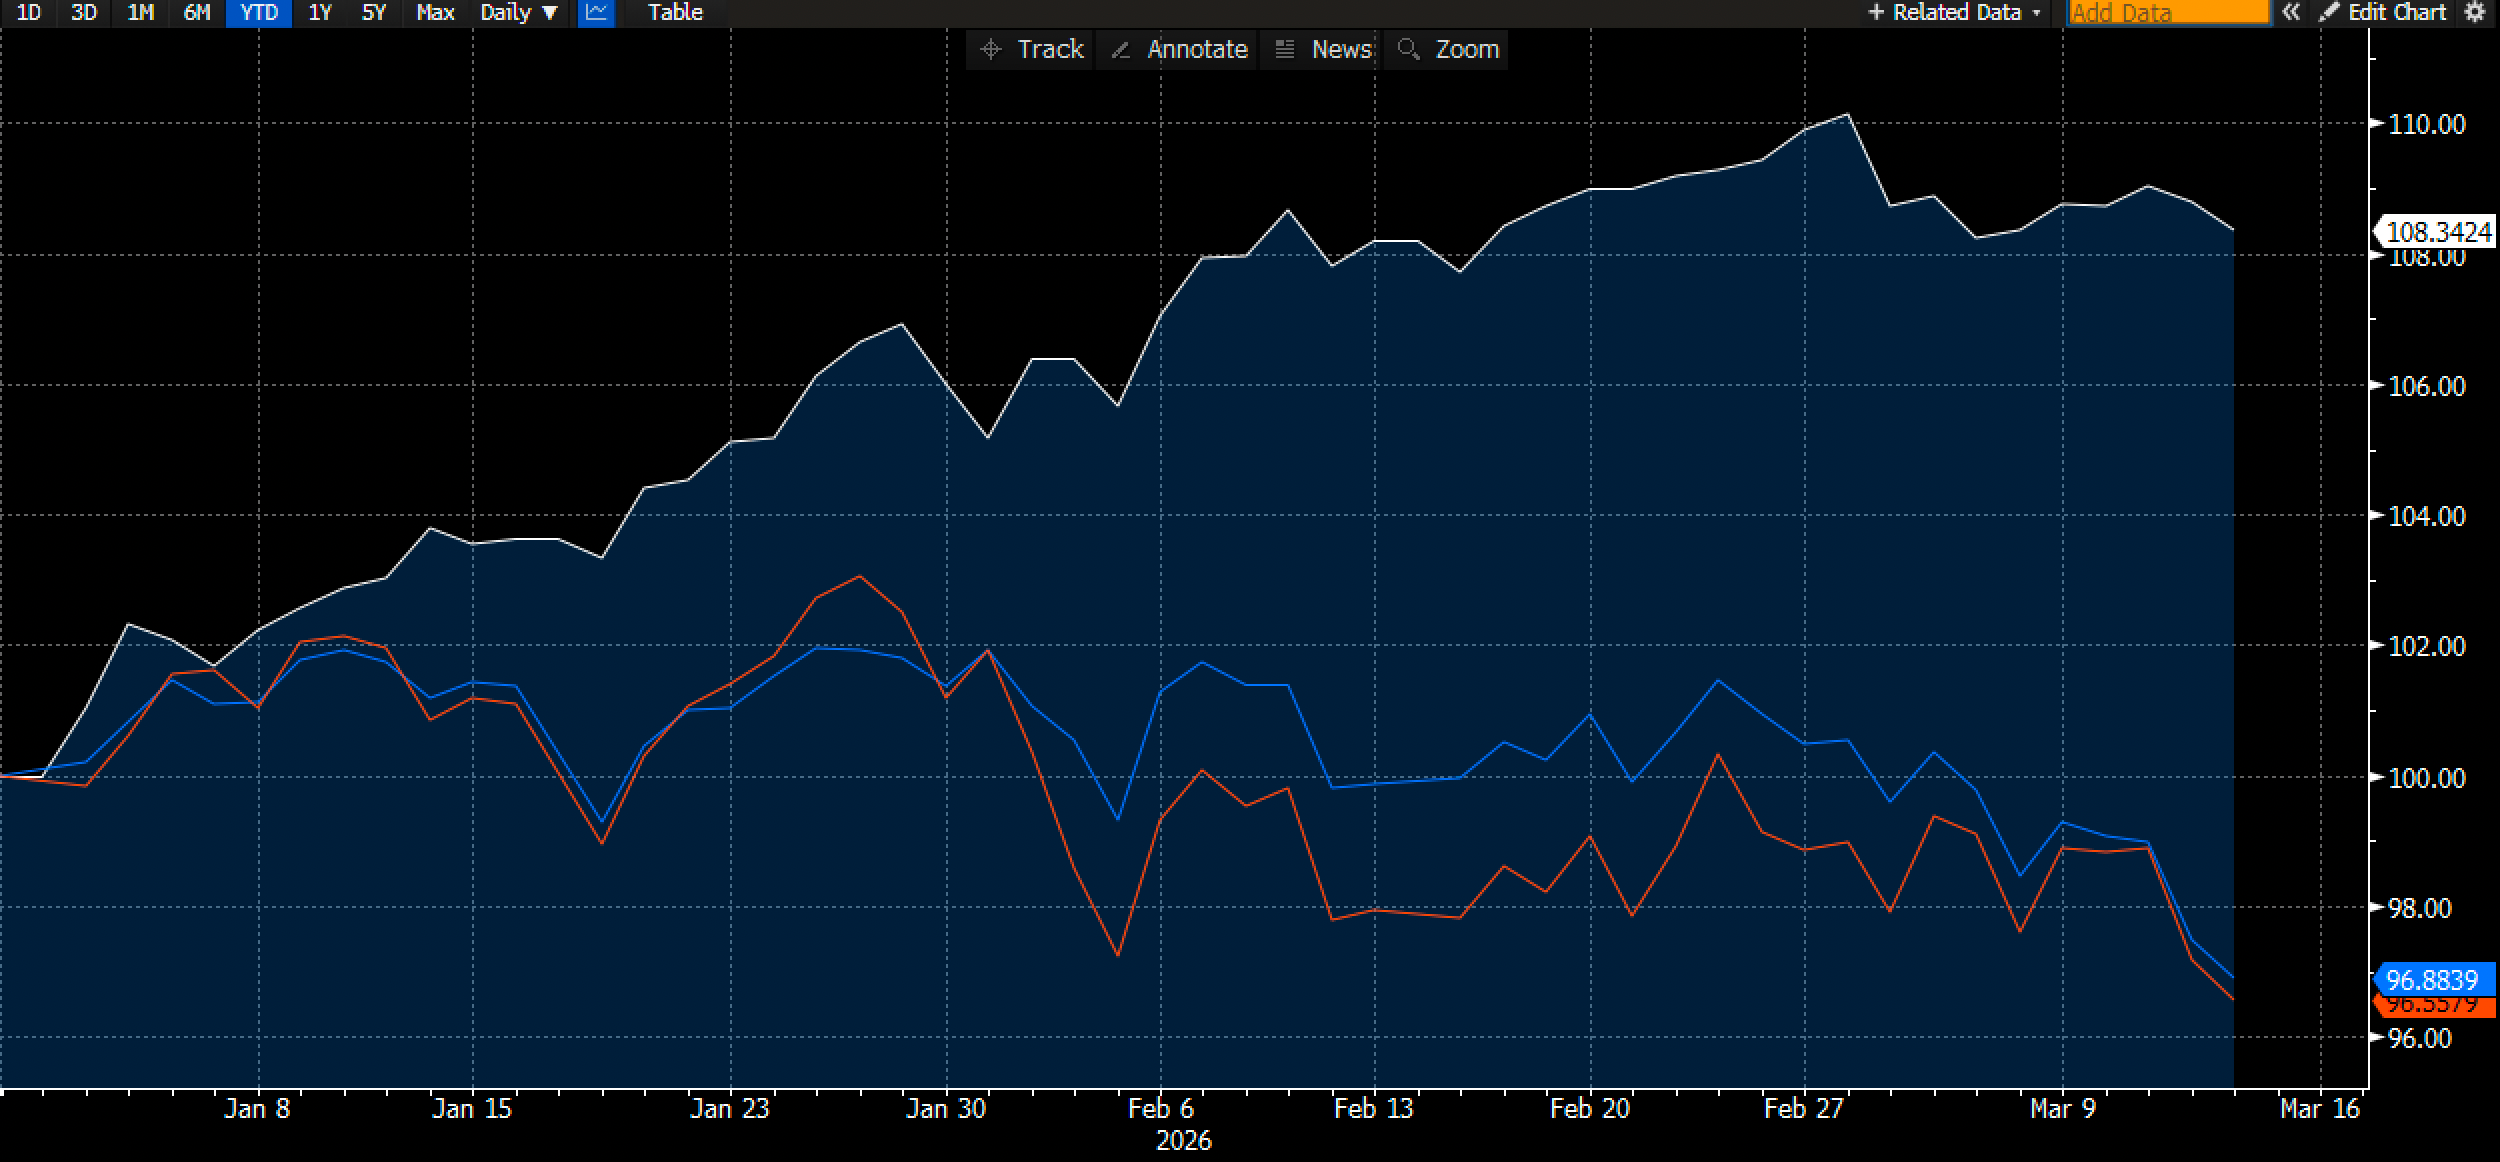
Our 2026 buy-and-hold portfolio is benefiting from the hedges that we had in place from the beginning of this year, specifically in anticipation of more volatile events. This has helped us not only post positive returns of 8.3% but also outperform US equity indices handsomely. Remember, your racing car is only as good as its brakes are able to slow you down in sharp corners.
Let’s now read my friend Macro D’s latest thoughts on the upcoming central bank meetings and Macro FX trade implications before we look through the weekly calendar, look at the newly launched macro chart dashboard and then finish with the output of our long-standing asset allocation model.
We will never stop. Shocks come and go, but a rigorous process, preparation, and timely observations through experienced lenses make me confident that, whatever the environment, we will continue compounding and learning.
Join in on the ride
