Thursday Thoughts
Quick Roundup on where Things Stand
The small reversal on Monday in risk and bond markets seems to echo in the distant past. The dominant forces are at it again, and with it, it brings renewed pressure in dominant trades. As I have been talking about in this week’s Macro Book, a great trade selection will entail selecting dominant trades, and this is precisely what the momentum model is trying to achieve. As with any momentum system, it will not capture the tops and bottoms; that’s why we are pairing it with the reversal model, which is attuned to scanning and pinpointing local turning points and exhaustion. I will write a more comprehensive guide soon.
The dominant trades for now are still very much the selling of bonds, steepening curves and selling in risk premia. For how long? This can not be answered by looking at momentum alone but is mostly found in the more nuanced analysis of the overall market structure when looking at equities. In my comprehensive thought piece on technical analysis from August 6th, I opined on how I view market structure as a key ingredient to analysing equity market forward returns. The following table was used as a guiding principle, where I concluded that we are likely transitioning from structure A to B, which can easily bring a 5-10% correction with it (we are at 9% currently).
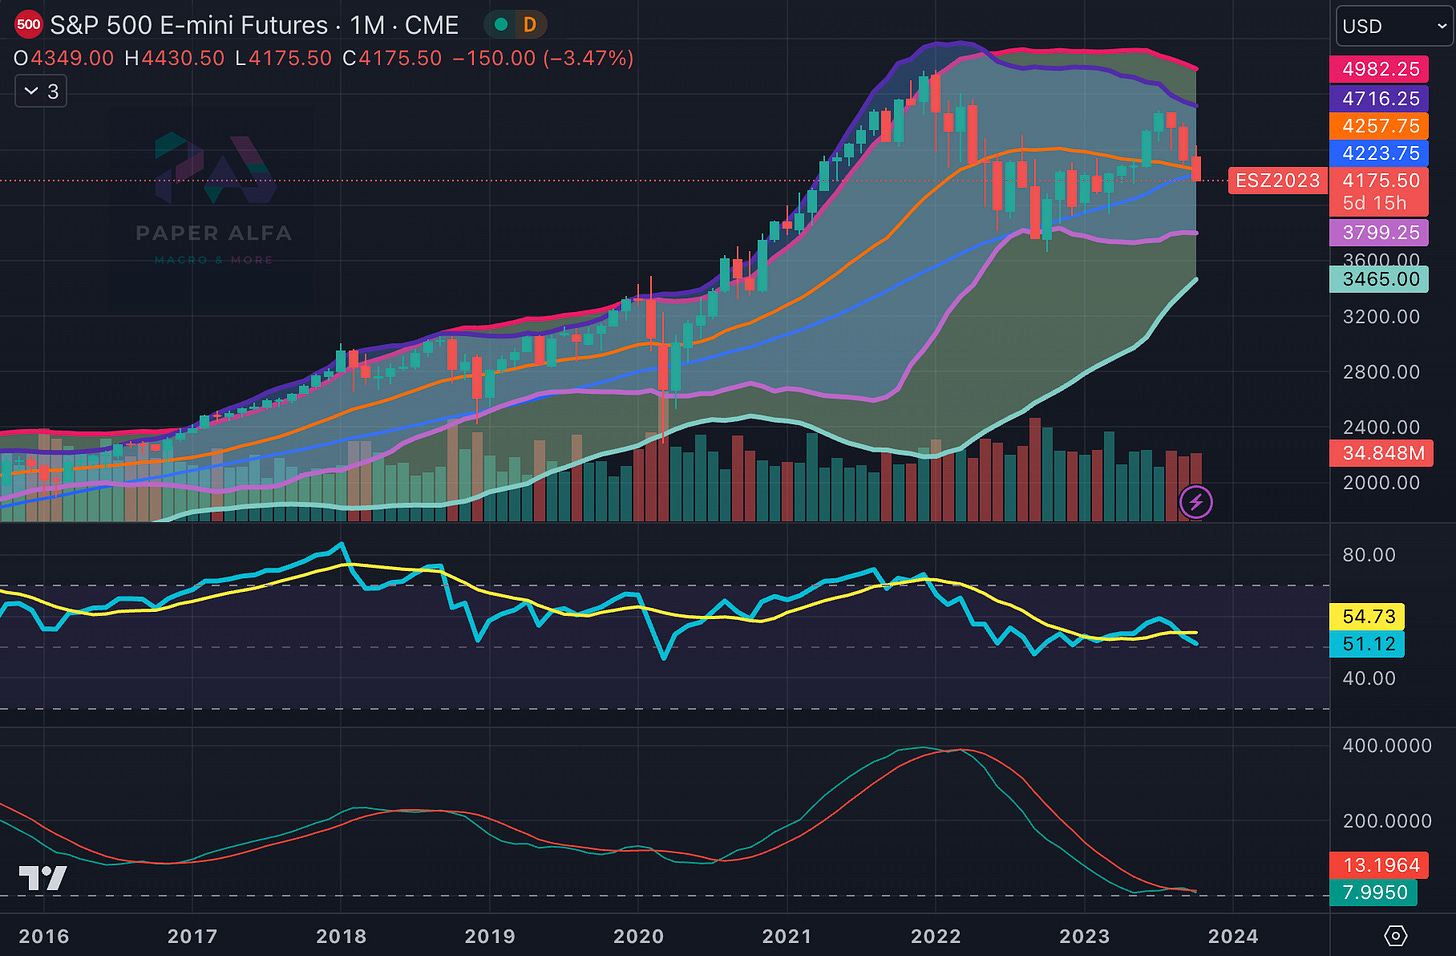
It is important to zoom out to conclude when looking at primary trends. That’s where I look at longer-term charts with monthly observations, as outlined below. This would suggest that the primary trend, while challenged, is still up. We are currently in the middle of the 20- and 40-month Bollinger bands, which are key levels. If broken, I could envisage us going to the lower end of the 20-month Bollinger band, which is currently sitting at 3800, but that’s just one possible scenario. Following the market structure logic, it would also seem plausible to find structure C for a while, which will be a sideway action until either the bull trend resumes or a new bear trend gets established.
This will be a little relief to those looking at daily market moves. That’s where the shorter momentum and reversal signals give us a guide as to how to tackle shorter time frames. Playing longer-term vs. shorter-term market moves isn’t contradictive. I can be short-term bearish but longer-term bullish; it gives me a roadmap to consider.
Today brings more blockbuster earnings, an ECB meeting and US GDP, where a decent print is very likely. ECB’s meeting is one of transition, in the sense that it marks one more step in the shift from interest rates to balance sheet as the marginal instrument of adjustment of the policy stance.
This is macro for you in a nutshell, juggling the long-term, short-term and micro landscape to extract Alfa.
Let’s look at some of the updated charts to see where we stand in shorter-term time frames …


