

The 1×2 — Beautiful Trap
One of the most seductive structures in fixed income and equity options. A trade that looks like free money until the day it absolutely isn’t.

Throughout my investment career — and especially during my years inside hedge funds — I have seen an almost obsessive fascination with one structure in particular: the 1×2 ("One-by-Two”).
It is spoken about with a certain reverence. Whispered about as if it were a sign of sophistication. A trade for the initiated. A structure that separates the “vol traders” from the tourists.
The mythology is always the same.
“We collect premium.”
“We structure it for zero cost.”
“It works most of the time.”
And that last sentence is precisely why it is so dangerous.
The true masters of the 1×2 are few and far between. They understand not just the payoff diagram but also the convexity profile, regime dependency, volatility surface dynamics, liquidity traps, and — most importantly — their own behavioural weaknesses. They treat it like a loaded instrument that requires constant supervision.
For the majority, however, the 1×2 is not a clever income tool. It is a slow-burning tail-risk engine. It generates months — sometimes years — of smooth carry, only to compress all the hidden convexity into one brutal episode. A structure that flatters you until it exposes you.
There are certain trades in markets that feel almost too clever. They carry an intellectual elegance — the quiet satisfaction of believing you have engineered something efficient. Something asymmetrically favourable. The 1×2 option spread is one of them. It has a way of making you feel very smart for a very long time, right up until the moment when it reminds you, very abruptly, that you were not.
In this educational piece, I want to properly disentangle the structure. Strip it back to first principles. Understand where the real edge lies — and where it evaporates. Examine why it works, why it blows up, and why so many intelligent professionals underestimate its convexity profile.
This is not a warning to avoid it.
It is a call to respect it.
Because the 1×2 is not inherently reckless. It is simply unforgiving toward those who misunderstand the regimes in which they operate.
If you run it, run it consciously.
If you size it, size it honestly.
If you collect premiums, understand what you are truly short.
I hope you enjoy this deep dive. Yes, educational pieces are always free.
There are certain trades in the market that feel almost too clever. They carry a certain elegance — an intellectual satisfaction that comes from feeling like you’ve figured out a way to get paid for doing nothing particularly risky. The 1×2 option spread is one of them. It has a way of making you feel very smart for a very long time, right up until the moment when it reminds you, very abruptly, that you were not.
I have watched some deeply intelligent, highly experienced traders run 1×2 structures as a core part of their book for years. Generating a steady income, harvesting volatility premium, and feeling justified in their approach month after month. And then one event — one sigma event that wasn’t supposed to happen — would undo multiple years of careful work in the space of a few trading sessions. Sometimes less.
This piece is not a warning to stay away. It is a guide to understanding the structure deeply enough to know when you have an edge, when you do not, and most importantly, why your edge can evaporate without much notice at all.
What is a 1×2?
The name is exactly what it says. You buy one option at one strike, and you sell two options at another strike. Both legs are in the same expiry. You are net short one option — that is the critical point. You are short gamma, short vega, and you are harvesting the volatility premium between two strikes.
In practice, you see this structure most frequently as a put 1×2 (also called a 1×2 put spread ratio) or a call 1×2, depending on the direction you want to express a view. The architecture — and the risk — is fundamentally the same.
Let’s use a practical example. Assume the S&P 500 is at 5,000 and you are structuring a one-month put 1×2:
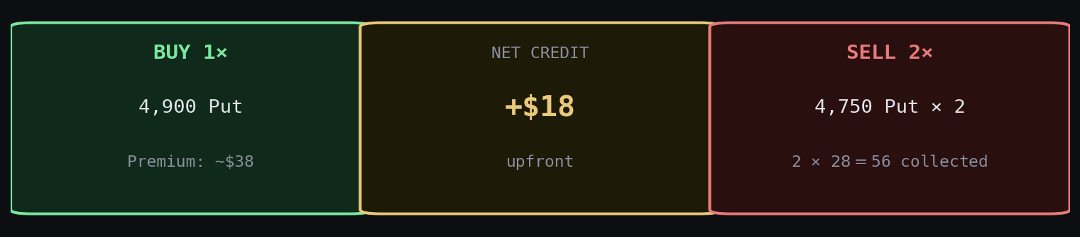
You buy one 4,900 put for $38 and sell two 4,750 puts for $28 each, collecting $56. Your net premium received is $18. That is your “free money.” It costs you nothing to enter. You get paid to be in the trade. You can see immediately why this is attractive — you are not paying for protection, you are being paid to provide it.
The Payoff Diagram
The shape of the P&L at expiry is what makes this structure both appealing and dangerous. The structure has three distinct zones. Above 4,900, both puts expire worthless — you keep your $18 premium. Between 4,900 and 4,750, your long put gains more than your two short puts lose, so you are actually making money as the market falls. Your maximum profit of roughly $168 is achieved at exactly the 4,750 strike — the sweet spot. Then, below 4,750, the trade starts paying out against you. Below roughly 4,582, you are losing money. And critically, as the market continues to fall, there is no floor in sight. You are net short a put. The losses are uncapped on the downside.
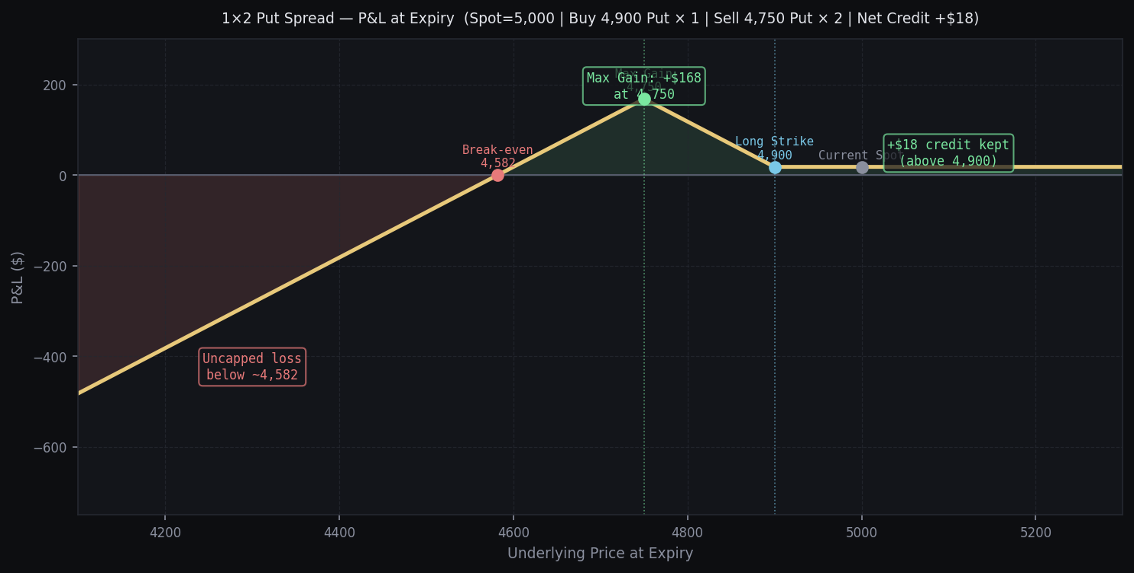
CRITICAL INSIGHT: The maximum gain zone and the blowup zone are separated by a single strike level. The same trade that made you look brilliant at 4,750 starts eating you alive at 4,700. That proximity is not an accident — it is the structural reality of the 1×2.
Why Do People Run This Trade?
The honest answer is that it works most of the time. Let’s not pretend otherwise, because if it didn’t work most of the time, nobody would run it. Markets do not, in the majority of months, gap down 10% in three days. Volatility surface dynamics mean that out-of-the-money options are almost structurally overpriced relative to realised volatility. You are exploiting a known and persistent pricing edge for tail risk.
In rates markets — where the 1×2 is arguably most prevalent — the logic goes further. Front-end rates traders (STIR) run 1×2 cap/floor structures or swaption 1×2s for several reasons beyond simple vol harvesting:
• First, the funding trade. If you believe the central bank will be anchored, the front end of the curve is mean-reverting. You sell the extreme scenarios and earn the vol premium. This is a fairly rational Bayesian view on monetary policy paths.
• Second, view expression at low cost. A 1×2 allows you to take a mildly directional position while essentially zeroing out the premium cost. For a money manager with P&L targets, starting a trade at zero or with a credit is enormously appealing.
• Third, vol surface arbitrage. When skew is steep, you can structure a 1×2 with a meaningful credit and still maintain a very wide safe zone. When vol is high and skew is steep, the structure’s appeal is magnified considerably.
• Fourth, the hedged version. Run the 1×2 against an underlying position and the risk profile changes entirely. More on this shortly — it is one of the most intelligent ways to deploy the structure.
The Greeks — Understanding Your Real Exposure
Let’s go through the Greeks of our example trade in detail, because this is where most traders who blow up on 1×2s were not paying close enough attention.
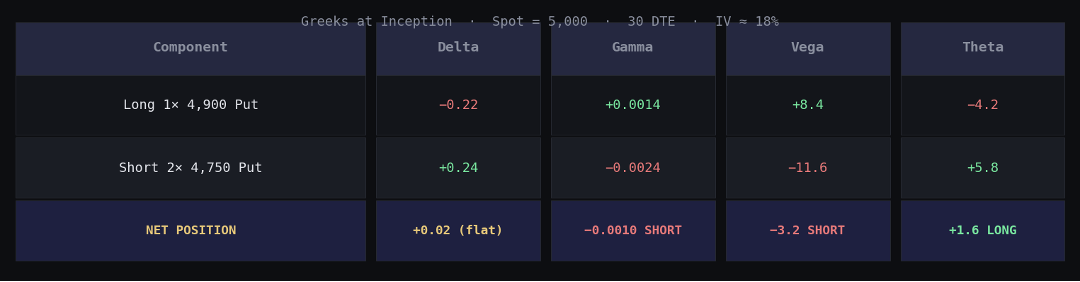
At inception, the delta is near flat — you have very little directional exposure at the current spot. That is by design. You are almost delta-neutral. The theta is positive — you are earning time decay each day. The trade looks benign from here. This is the seductive part.
But notice the gamma and vega. Both are negative. You are short gamma, meaning every market move costs you. You are short vega, meaning any increase in implied volatility hurts you. The trade needs the market to stay quiet, stay rangebound, and certainly not reprice volatility higher. It needs time to pass without incident.
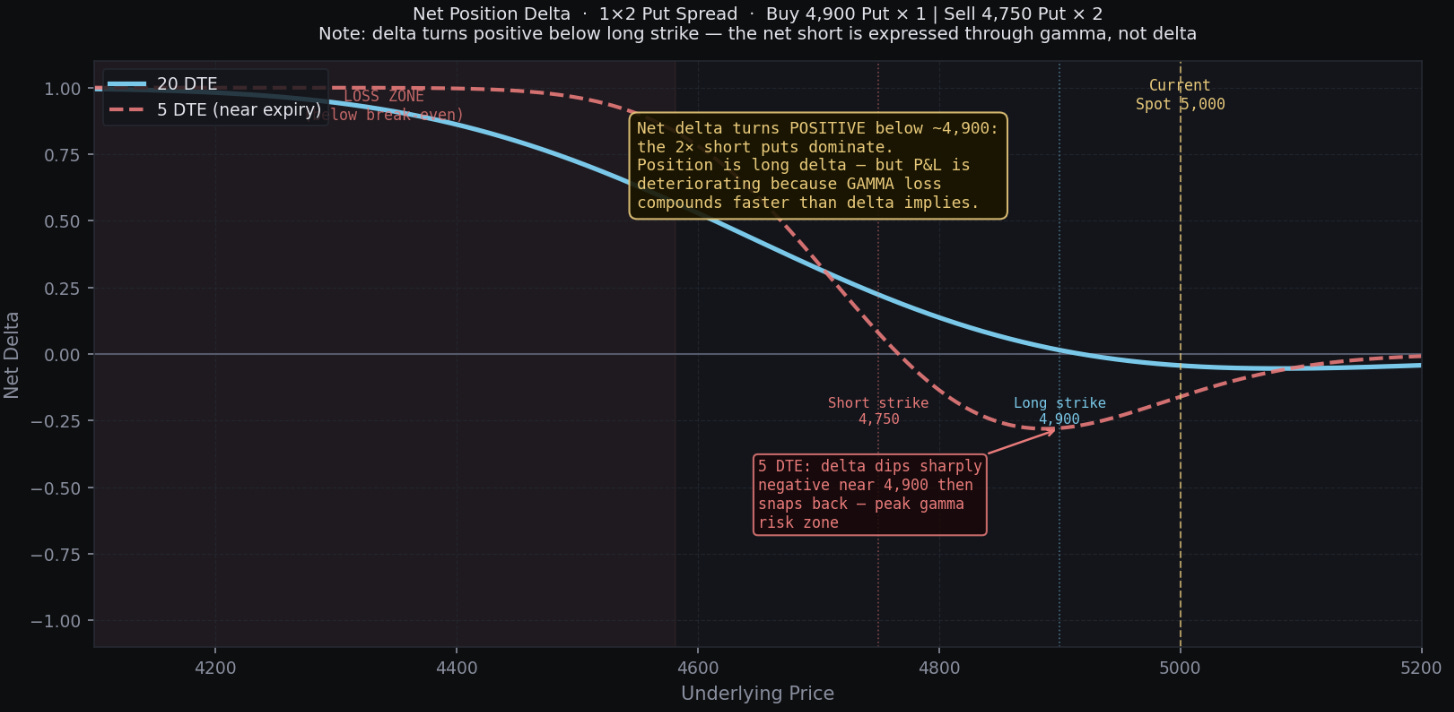
The delta chart below is the one that matters most. Notice how, as the spot falls from 5,000 to 4,750, your delta becomes increasingly short — the trade starts going against you. And critically, the rate of change of that delta (the gamma) is negative and accelerating. When spot breaks through 4,750, you have maximum negative delta and maximum gamma exposure precisely at the moment when markets are most likely to gap. This is the core danger of the structure.

Scenario Analysis — Show Me the Money
Let’s run through a set of expiry scenarios to make this very concrete.
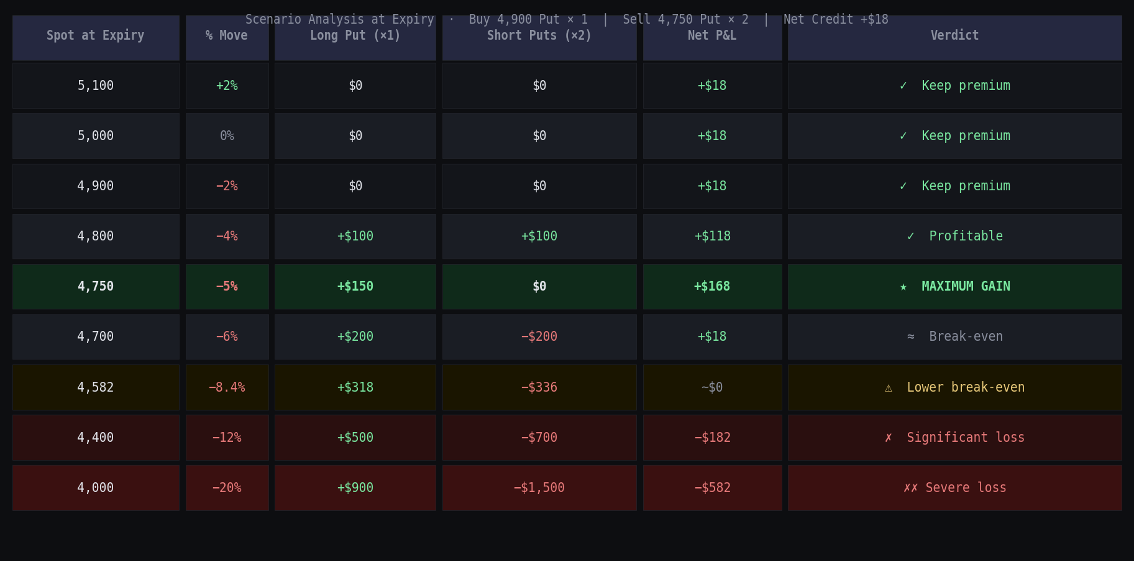
The trade works in 4 of 8 broad scenarios. It only breaks down if the underlying moves decisively through your short strike and continues lower. But that “only” is doing a lot of work in that sentence. A 12% decline in the S&P 500 is not a theoretical black swan. It happens. And in rate markets, it can happen even faster.
When You Have an Edge — and When You Don’t
This is the part that requires genuine intellectual honesty. The 1×2 is not intrinsically good or bad. It is a tool, and like all tools, the question is whether you are using it in the right conditions.
Conditions Where You Have the Edge
• Elevated implied volatility with steep skew. When vol is high and the skew is pronounced, you receive a disproportionately large credit for the lower strikes. The risk-reward tightens in your favour. You are harvesting overpriced fear. This is your bread and butter environment.
• Anchored macro regime. In periods where the central bank is clearly on hold, inflation is settled, and the macro regime is relatively predictable, tail scenarios are genuinely less likely. Boring is beautiful for this trade.
• Selling strikes with near-zero catalyst risk. Running a 1×2 into a quiet period with no scheduled data surprises, no geopolitical flashpoints, no central bank pivots on the horizon — time decay works for you every single day.
• Liquidity depth at your strikes. You need to be able to manage the position — hedge delta dynamically, roll the structure, or exit cleanly. Wide bid-ask spreads in illiquid options eat your theoretical edge.
Conditions Where You Have No Edge
• Low vol, flat skew environments. When implied volatility is depressed and skew is flat, the credit you collect is thin. You are taking the same tail risk for much less compensation. The asymmetry is unfavourable.
• Approaching binary macro events. FOMC decisions. NFP. CPI. Geopolitical risk events. The 1×2 is structurally allergic to sharp, unexpected moves.
• When you don’t have a firm view on the range. The 1×2 is implicitly a range trade. If you cannot say with genuine confidence where the underlying will stay, you are flying blind.
• In high-convexity regimes. When spots gap-move, vol spikes simultaneously. Your short vega and short gamma compound each other in a way that creates non-linear losses. This is the regime that kills the trade most violently.
THE OVERLAY TRADE — 1×2 AGAINST THE UNDERLYING
If you hold the underlying — long bonds or long equities — the 1×2 put spread can be structured as a partial monetisation of vol premium while maintaining your core position. Your long underlying provides a natural floor to your exposure below the strikes. The 1×2 helps you harvest income from the options surface without owning the naked tail risk. This is how sophisticated fixed-income portfolios have long used swaption 1×2s — as vol overlays to reduce carry costs on outright positions, rather than as standalone speculative structures.
The SVB Death Knell — March 2023
March 2023 — A Masterclass in Tail Risk
If you want to understand why sophisticated traders with years of experience can be brought to their knees by the 1×2, you need look no further than the Silicon Valley Bank collapse of March 2023. This event was uniquely, almost surgically designed to destroy front-end rates 1×2 structures.
For much of 2022 and into early 2023, front-end rates traders — particularly those running SOFR or Fed Funds options books — were happily running 1×2 receiver swaption structures. The logic was entirely rational: the Fed had been hiking aggressively, terminal rate expectations were elevated but arguably anchored, and the vol on short-dated rate instruments was richly priced. The trade: buy receivers at one strike, sell two receivers at a lower strike — essentially positioning for a world where the Fed would eventually cut rates modestly. Collecting premium, theta-positive, carry-positive. Hundreds of desks ran some variant of this.
Then the weekend of March 10th, 2023, happened.
SVB failed. What followed was not a gradual repricing. It was a flash re-assessment of the entire monetary policy path. Within 48 hours, markets went from pricing a further 50bps of Fed hikes to pricing emergency cuts. The 2-year US Treasury yield fell by over 100 basis points in three trading sessions. To put that in context, you need to go back to the 1987 crash or the 2008 financial crisis to find comparable intraday moves in that part of the curve.
Front-end swaption vol — SOFR options, eurodollar options, 1-year into 1-year swaptions — exploded. Implied volatility on these instruments effectively doubled or tripled in the space of a week. For anyone short gamma in that space, the losses were staggering. You were short two options that were simultaneously moving violently against you, and every attempt to hedge the delta simply added costs in a market that was gapping rather than trading continuously.
The 1×2 traders got hit by three simultaneous forces: the underlying moved violently through their short strikes, implied volatility exploded (destroying their short vega), and the gamma acceleration meant their delta hedge ratios were changing faster than they could manage. Classic short gamma blowup, amplified by the fact that this happened over a weekend and into an illiquid Asian Monday open.
I know of desks at reasonably well-capitalised houses that lost months of accumulated carry income in a single week. Some lost more than that. The trade that had generated steady, reliable, and explainable income for the better part of a year became an existential risk. Heads rolled. Limits were revised. Some books were closed entirely.
The SVB episode is instructive not because it was uniquely foreseeable — it wasn’t, at least not in its specific form — but because it illustrates the fundamental fragility of any strategy that is structurally short convexity. You can be right 47 out of 48 months. But the 48th month does not ask for your track record.
“The market can stay quiet long enough to make you complacent, and then dislocate fast enough to make that complacency catastrophic.”
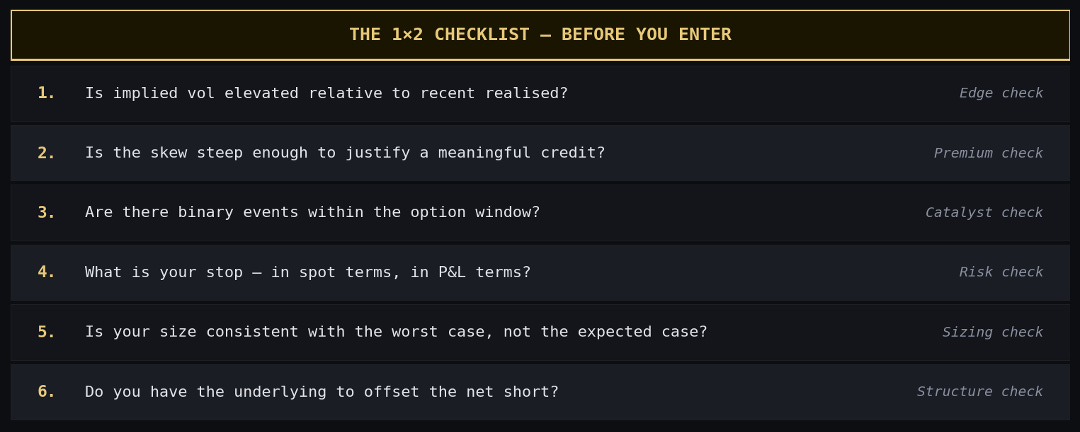
Managing the Trade — What Professionals Actually Do
• Pre-define your stop. Before you enter the trade, decide at what spot level, at what implied vol level, or at what mark-to-market loss you will exit or reduce. Not when you are bleeding. Now. Pre-commitment eliminates the psychological trap of hoping a losing 1×2 will recover.
• Size appropriately. The 1×2 generates modest premium. Many traders compensate by running it in large size. This is the trap. Size it so that a worst-case scenario — your short strikes breached by 15% — represents a defined, acceptable fraction of your portfolio.
• Monitor the skew closely. Skew is your early warning system. If near-the-money vol is stable but the skew in the lower strikes is steepening, the market is telling you something. Someone is buying protection. Follow that signal.
• Roll proactively, not reactively. As time passes and spot moves, your short strikes move in and out of sensitivity. Rolling the structure to adjust strikes or extend expiry is a skill in itself. The traders who manage 1×2s successfully over long periods are almost always active well before the position becomes uncomfortable.
Final Thoughts
The 1×2 is a genuinely useful and intellectually interesting structure. It represents a very specific market view — that vol is overpriced, that tails are too fat in implied space relative to what the world will actually deliver — and when that view is correct, it rewards you handsomely and consistently.
The danger lies not in the structure itself but in the habit it creates. Running 1×2s month after month, watching the premium accumulate, builds a psychological dependency on the income stream. It becomes your expected baseline. And when a dislocating event arrives — and it always eventually does — the combination of oversize positioning, insufficient hedging, and psychological reluctance to crystallise losses can turn a manageable setback into a genuine catastrophe.
Know your strikes. Know your vol. Know your stop. Respect the convexity. And never forget that the trade looks most attractive precisely when the market has been quiet long enough to make you forget why caution was warranted in the first place. That is not a coincidence. It is the structure working exactly as intended — against you.
DISCLAIMER: This newsletter is for educational and entertainment purposes only, not investment advice. Nothing in this newsletter is an offer to sell or to buy any security. The author is not responsible for any financial loss you may incur by acting on any information provided in this newsletter. Before making any investment decisions, talk to a financial advisor and conduct your own research.
Great post. Used to get pitched these multiple times a week. They are always wonderful on paper and a mess to trade unless you are an expert at hedging.