I had originally put the below together back in March when SBV-related volatility waves entered the market. Back then, there were only a few stress signals flashing as far as global monetary plumbing was concerned.
I have refreshed the charts for the current period and added a few new ones for your information. I hope you find this useful.
Secured vs. Unsecured Spreads
This is my best attempt to plot 3m FRA (unsecured 3-month funding) vs. 3m OIS (secured 3-month funding). I have also included the TED spread (3-month FRA vs. 3-month T-Bills in the green line below). While I don’t have data from the GFC, the widening there was roughly three times as much seen in March 2020. While the basis is as wide as earlier this year, it does not show any signs of further stresses currently.
FX Basis Swap (EUR/USD 3-month)
This is quite often mentioned on fintwit. In short, this is the spread added to the non-USD leg when swapping the basis from EUR to USD funding. A negative number indicates a preference for USD funding in the basis market compared to EUR. The more negative the number, the more demand (or stress) there is for USD funding. There is modest stress on that front, and this is probably the reason why the international swap lines have been extended to daily use. We are, however, not yet near the levels from March this year.
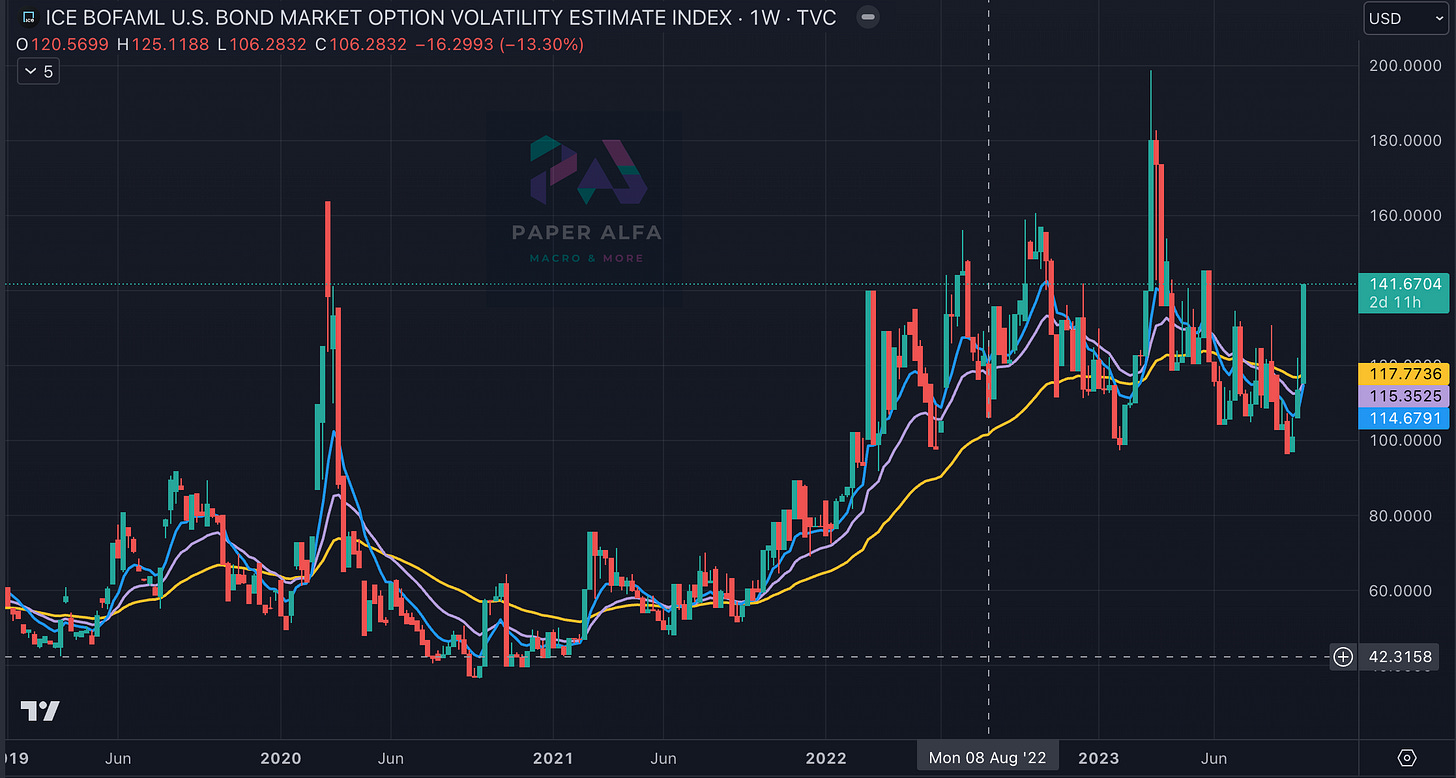
Bond Volatility (Implied from Options)
The Move index has had a pop higher but is not near the extreme levels from Q1 this year. The stark difference now is that we are witnessing a pop in volatility in a sell-off while we had an explosive move higher in option-implied volatility earlier this year on a massive bond rally post the mini-banking crisis.
Looking at the volatility smile in SOFR swaptions would clearly show a higher downside skew for shorter maturities over a 1-month horizon (green). Meanwhile, 10-year and 30-year maturities now see a higher right-hand skew, meaning higher implied vols for higher rate strikes.
Credit CDS (High Yield, Financials and High Grade)
There is a pretty sharp widening in high-yield CDS spreads (blue line), while investment-grade corporate CDS are witnessing some widening but nothing dramatic. I also included Financial CDS (orange line) as a comparison. I would be worried if that would widen more aggressively than the overall corporate CDS index. The yellow line is the CDS on the US sovereign (in EUR). Despite the heightened fiscal concerns, it has hardly moved and, if anything, tightened a bit.
The below is an admittedly hard-to-read global CDS heatmap across industries. The red blocks are showing the highest spread moves this month so far. Unsurprisingly, you will find them in high yield space and some high octane Emerging market countries (Argentina in that case).
Commercial Paper (Spreads to Treasuries)
CP’s are very shorted dated money market securities which many corporates and banks use to fund themselves. Very wide spreads, like in 2008 and 2020, would indicate severe stress, making it impossible for firms to fund themselves and get shut out entirely. Low stresses in that part of the market at the moment, similar to the experience earlier this year.
Good Luck out there!


