On Options ...
The world were many lose money
I came across options in my student years. A friend of mine urged me to pool some money and start trading them on some stocks on the local stock market. It went well in ‘97 and we tripled our stack. Then, ‘98 came with the Russian and EM crisis, and we lost it all. After that experience, I tried my luck with shorter-dated options, usually with 1 or 2 weeks until expiry, they were cheap. Even though I knew the math behind it, I didn’t grasp how fast time runs against you. I would stop my financial adventure after I burned through a large part of my savings.
Needless to say that in between theory and practice in financial markets lies usually a very large divide. So, if you are thinking of starting trading in options get some of the theory right and then look at market dynamics, bid/ask spreads, and operational aspects of letting options expire.
In my career, I have traded tons of options, either on FX (which is OTC and you can structure them very exotically), on fixed income securities (exchange traded on Futures, OTC on swaps), CDS (OTC) and stock index futures.
I am generally a buyer of Vol, so I am long Calls and Puts or any funkier structure mostly as a protection against unwanted blind spots. Over 90% of my option trades expired worthless. That’s the price of insurance. The best protection trade came in the form of SPX puts back in February 2020. You can see the details in the below chart. The lower green line is the SPX Future while the upper chart shows the implied volatility of a 25-delta 3m options (white), while the blue line shows the 2700 put option I bought as protection. It is rare but yes, you can have a 10-20x on your options, and I certainly needed it back then.
While it is certainly attractive to trade in options, the success rate, by definition, has to be very low if you are buying them. While in linear products like bonds or equities you will in theory have an eternity to be proven right (although, that is also potentially a quite daunting and loss-making proposition), options magnify the money-making proposition by quite a few angles. You will have to be right not only on direction but also on timing and the extent of the move. Not an easy task.
The most profound element to me was always time. I would usually trade 3-month options as liquidity further out dries up (for good reasons). It is incredible how quickly a quarter of a year passes and how fast you can get priced out of your strike or when volatility just goes against you. Time decay (theta) accelerates as you close in. And poof your premium is pretty much gone.
Dylan Grice from Calderwood put something very interesting together last year, showing how buying protection can be costly, depending on the price you are paying.
The below chart shows the skew between 50 delta and 25 delta SPX puts which in 2022 almost was as expensive as in 2008.
Unsurprisingly, the results of overpaying for protection vs. not having any protection are basically the same. That certainly was the lesson from last year.
Some Basics
I am sure that if you studied options you are already familiar with some of the terminology and the greeks. I am not going to summarise it here so if you are new to it, have a look at a good intro here. And as for the greeks, here.
I always thought of bringing the most complex concepts into a more intuitive world. GS has made a great example with a presentation which I have kept from all those years ago. I have linked it up here if you want to download it.
Here are some of the main concepts to remember:
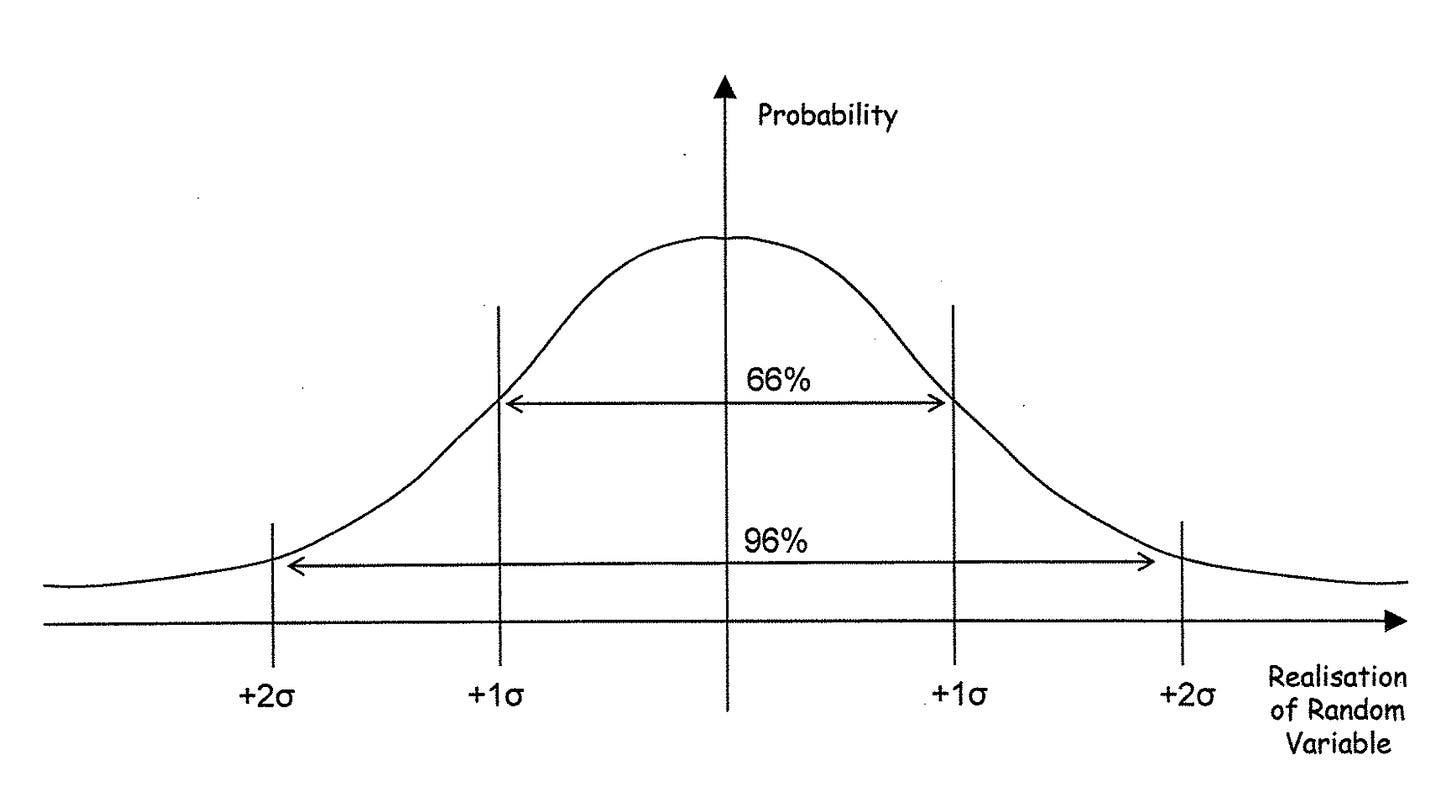
It all starts with a normal (gaussian) distribution where roughly 66% of the observations are within 1 and 96% of observations within 2 standard deviations.
You can now simplify the distribution into 4 blocks with 1/2 standard deviation and 3/2 standard deviation being the middle of the block.
The price of an option is its probability x payout. In this case, the at-the-money call option equates to roughly 40% x standard deviation (GS rounds down).
The real world, of course, does not deal with normal distribution lightly so you will have different implied vols along different strikes and maturities.
Another important rule to remember is that volatility scales with the square root of time. So say you have an annualised vol of 10%. The monthly vol would be 10% / Sqrt(12) = 2.89%.
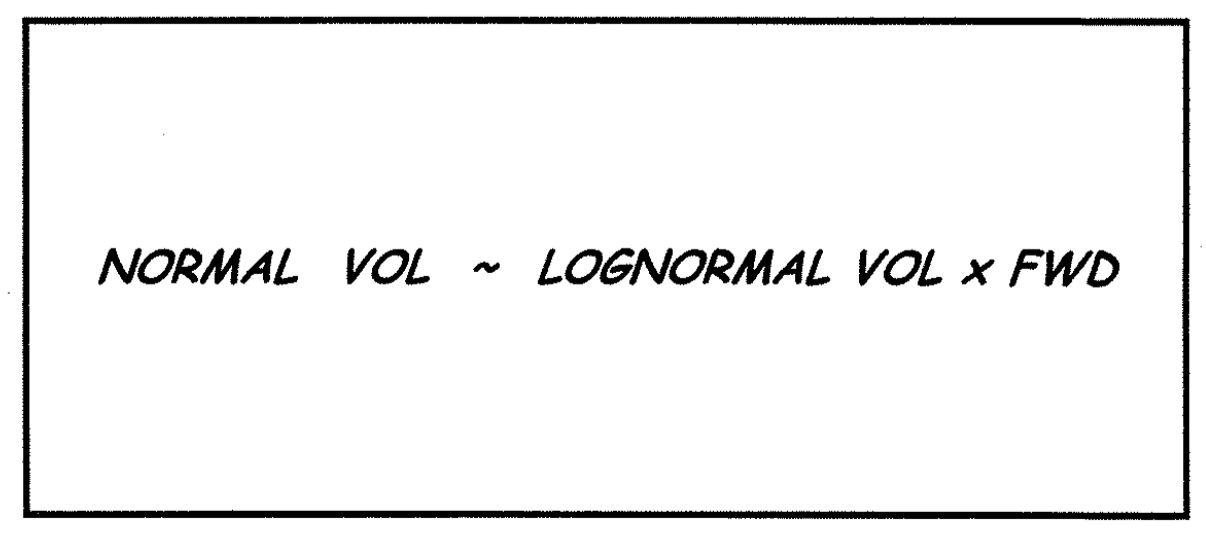
Option pricing models are using lognormal distributions as prices can not go negative. A quick thing to remember is the below.
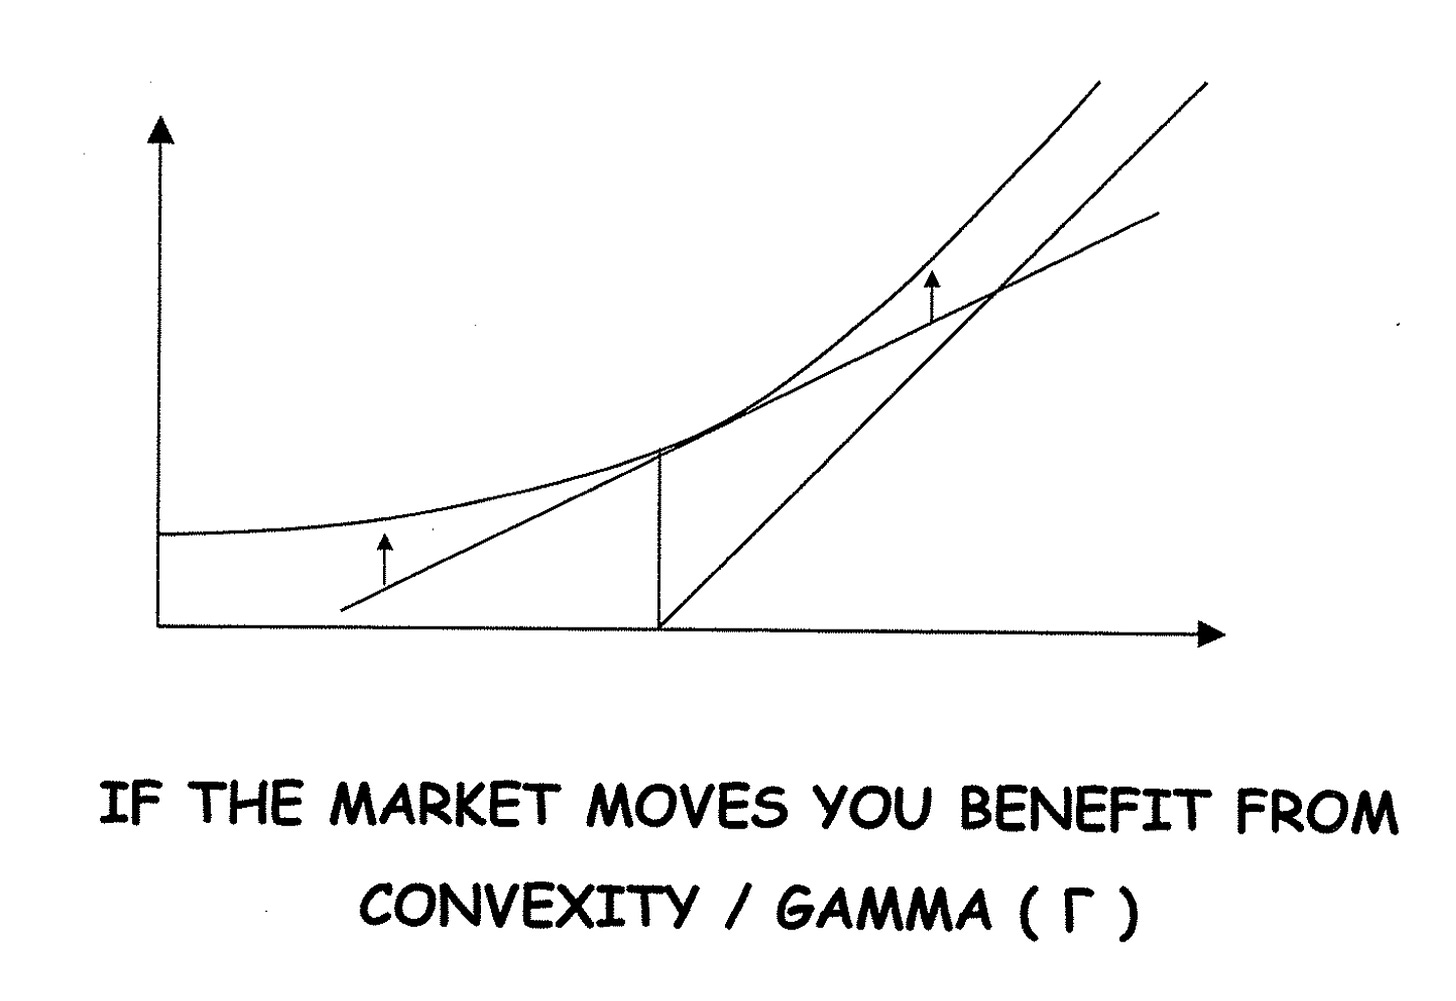
Thinking of greeks graphically is also something I find very useful. The below shows the time value impact of a call option.
Similarly, gamma is the change of the delta of an option and hence the benefit of convexity.
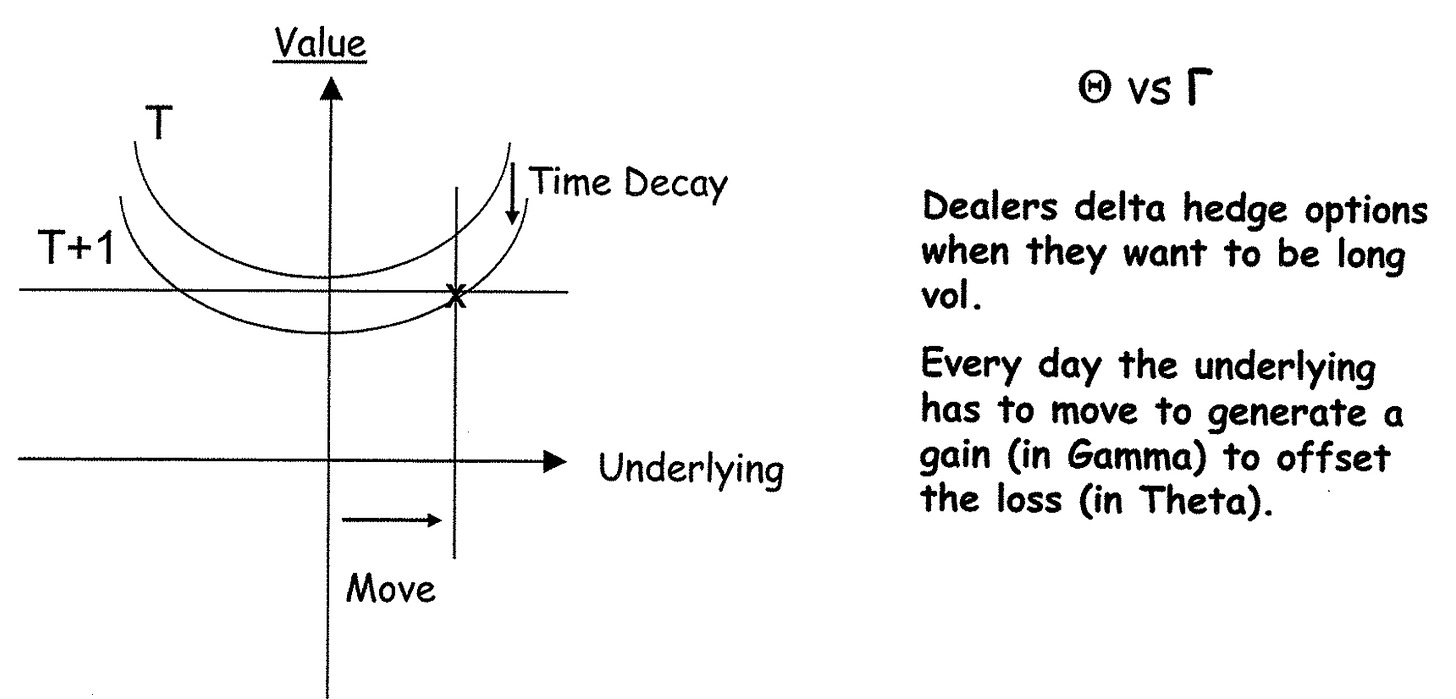
The flipside of gamma is theta as the greater the time decay kicks in the more the move needs to be in order to offset the rapidly decreasing option value. Think of it as a break-even calculation.
Calculating your daily break-even rate from vols which are naturally always annualised is another good way of looking at things. As there are normally around 252 trading years in a year. Sqrt(252) equals roughly 16. So that should give you roughly a daily move given its volatility.
Hope that was useful. Enjoy!
Your,
Paper Alfa


Appreciate you! Shout out to Capital Flows for recommending this read. You both do great work!
For those interested in a summary of The Hour Between Dog and Wolf
https://www.google.com/search?gs_ssp=eJzj4tVP1zc0LEgpKMmoNDQ2YPSSLclIVcjILy1SSEotKU9NzVNIyU9XSMxLUSjPz0kDAFx0D4I&q=the+hour+between+dog+and+wolf&rlz=1C1RXQR_enUS975US975&oq=the+hour+between&aqs=chrome.4.0i355i512j46i340i512l4j0i512l2j69i61.17538j0j4&sourceid=chrome&ie=UTF-8#fpstate=ive&vld=cid:86304a88,vid:uztqyc88ahg