Model Signal Alert
October 4, 2023
As mentioned in yesterday’s tweet, I shall give a quick update on the most pressing things in markets in this post. Things are moving fast, so it is only fair that I give you the view directly from Paper Alfa’s deck.
The short story is that pretty much all momentum positions are doing very well. Short Bonds and Equities, Long the USD and Energy commodities is the short version. An equal-weighted basket of those views would have generated a very respectable performance over the past few weeks. While this is good, I can not help but question the duration of such a winning streak. While we had some reversal signs flashing last week, the bounce in bonds and equities / sell-off in the USD and Energy only lasted a day and a half. The positive risk pop post the weekend’s shutdown announcement was immediately sold while data still remained somewhat positive. For now, the reversal windows are closed.
The market is rightly nervous ahead of important US employment data. Scanning my contacts at larger institutions would suggest that people watch this in amazement. Pretty much all institutional houses are obviously sitting on a lot of fixed-income paper; most of them marvel at the sight of near 5% yields in the US, something that many of them haven’t even experienced in their careers.
dharmatech is a handle in TradingView (TW) worth following. He comes up with great indicators, such as the yellow line below, which is computing the area in inverse yield curve territory. An upward-sloping curve indicates a generally steepening bias across the US yield curve. You can immediately see the strong correlation to the USD (blue line) and, more recently, also the negative correlation to equities (orange line, mini-S&P 500 future). There is nothing overly surprising here, but just something you might want to add to your TW setup for monitoring purposes.
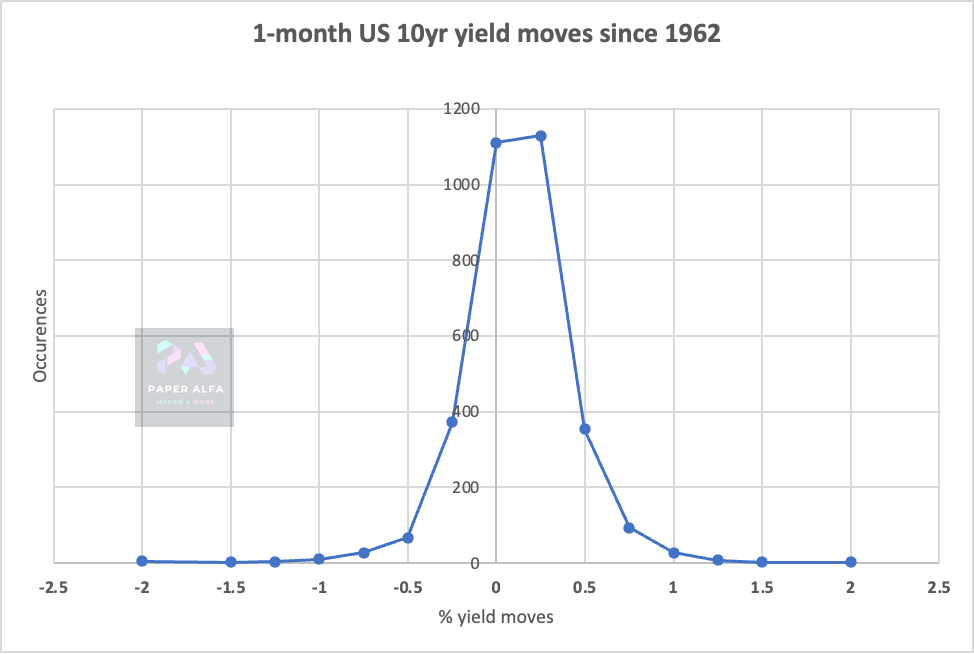
The scare-mongering about higher yields is very notable. Let’s look at some actual data for context. Below, I charted a very basic chart using data since 1962. It shows the 1-month change in US 10-year yields as a histogram. The around 60 bps backup over the past month isn’t as uncommon as people think. More than 350 times, we had a similar occurrence over the observed historical period, which accounts for around 10% of all occurrences.
Looking at the same data since the early 90s across time would also indicate that the monthly change (orange line) isn’t something extraordinarily rare. What was rare, however, was the 12-month sell-off, which obviously occurred over the past few years.
Looking at curves would suggest a more sinister picture. Keep in mind that steepening is not exclusively a bear steepening. The below chart shows the 2-10s US yield curve in blue, with the monthly change again in orange and the yearly change in purple.
I can understand people wanting to make the case that the term premium is too low and that normalisation could easily take them to a 100 bps delta over 12 months. I agree with the historical facts. I have a hard time envisaging such a move, however. Everything is possible, of course. Remember that this is as much about the fiscal situation as it is about the Fed, hence the rather aggressive risk premium expansion.
Meanwhile, global manufacturing trends are showing signs of bottoming. China’s Manufacturing PMI returned to expansionary territory - the first time in six months (50.2 vs. 49.7 last). The likely confirmation of a cyclical bottom in the Chinese economy will only support global recovery from here - the latest Eurozone PMIs also show slight signs of improvement, though Asian PMIs remained soft. Chinese property weakness poses risks to the potential rebound.
USD/JPY has been rocked just as it looks above the 150 mark. No official confirmation on this move, so stay tuned. Some FX strategists see "rate checks" as the likely next step, ahead of strong verbal intervention: “We will take determined action against speculative moves.” A meeting between BoJ, FSA, and MoF has been pointedly announced in the past.
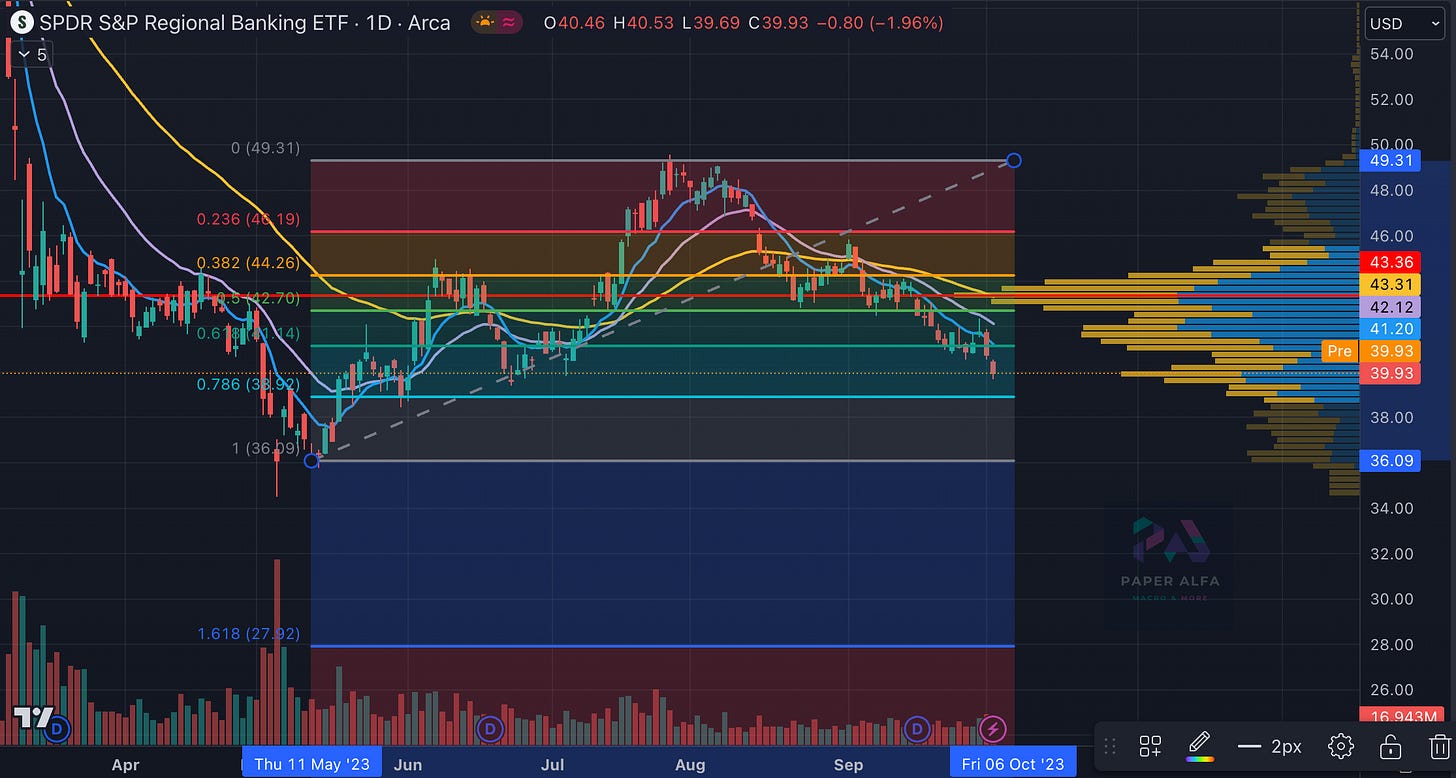
KRE (US Regional Bank ETF) has now retraced more than 50% of its post-March fiasco bounce. This is obviously not a good development.
Let’s now look into a bit more detail across the various asset classes.


