How often do Macro Opportunities arise?
More often than you think
It feels like there are only a few opportunities in a calendar year to catch a momentum shift in a security or asset. FOMO kicks in, and you feel like you’ve missed out on one of only a few “home runs” the market is offering.
Over the weekend, I met a friend of mine who runs his own systematically oriented fund. Turns out he had already done the bulk of the research, which he was happy for me to share. You can find the full publication here. They went back over 40 years and analysed various asset classes.
In simple terms, the analysis looks at ATR (average true range) which is a popular technical analysis study which encapsulates volatility of the underlying over the past, typically 14 days by looking at the most recent ranges between highs & lows.
They define a major opportunity as every price move which, within 1 year extends at least 30 times the average daily price range without experiencing a retracement greater than 10 times the average daily price range. This ends when a retracement greater than 10 times the average daily price range occurs or when the price move fails to make new highs or lows within one year. Accordingly, an opportunity can last longer than one year.
They set an example with Corn prices from 2010 to 2011, which should hopefully be self-explanatory.
Running the machines would spit out an average of roughly 1 opportunity across a wide range of assets per month. Note that the study ends in 2018/19, but given its 40-year track record, that relationship should still hold and, given the volatile 20-22 period certainly in line with previous trends.
That is pretty surprising and should make you feel confident and focus to let the past be bygone. There is a constant focus on the next opportunity, and given they arrive more frequently than you might have thought, all energy should be used in identifying precisely those. This is also the background to Paper Alfa’s proprietary model, which is precisely on the hunt for those break-outs and reversals. You can subscribe to find out more.
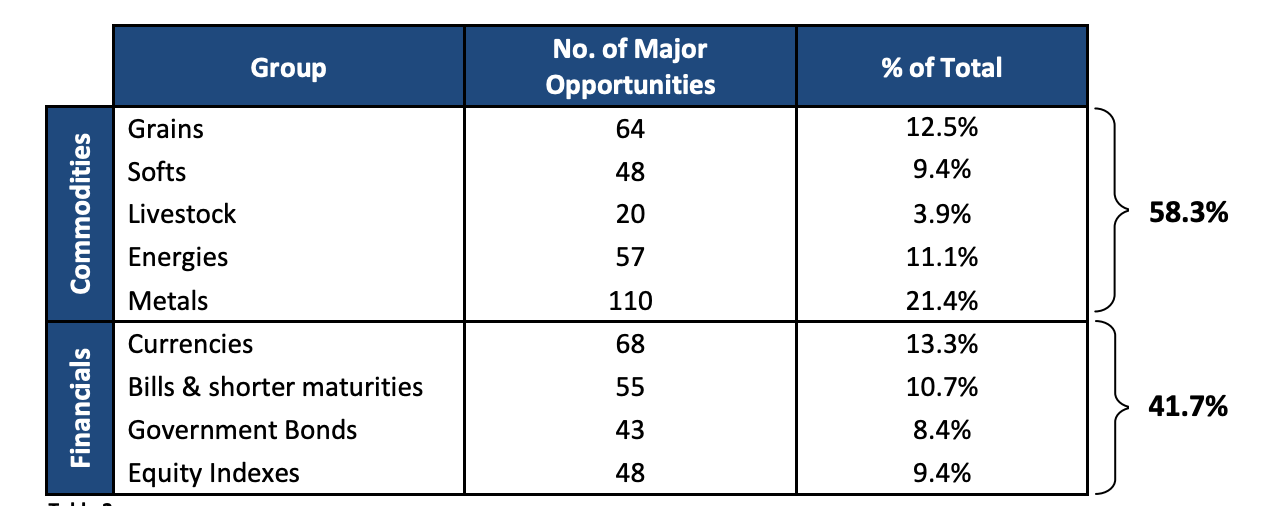
It would also appear that most of the opportunities arise in the commodity complex. This is unsurprising to me as commodities experience more frequent boom/bust cycles than their financial counterparts due to their supply/demand dynamics which are self-fulling by nature.
More interestingly, Commodity futures seem to exhibit a particular upward bias in momentum, whereas FX is most balanced (mean-reversion), with Bonds, given its 30-year bull run, unsurprisingly leading the pack.
Group opportunities are another interesting analysis. It looks at concurrent moves of a minimum of two futures pairs within the same group. Looking at the below table, for example, highlights how Bonds move at certain big inflexion points brought upon by monetary actions before the GFC and as well as a prolonged period in which QE dominated.
Conclusion
There are more opportunities than you think when looking at the full-scale macro opportunities set, including currencies, bonds, equities and commodities.
The excellent research summarises the main points as follows.
Major Opportunities occur in every calendar year between 1979 and 2018.
Major Opportunities exist for both upward and downward price motions, with a notable higher frequency for upward price motions amongst Commodities Futures.
Major Opportunities are well distributed amongst Futures Groups.
On a 12-month moving average basis, the number of Major Opportunities per month oscillates around one
I hope you find this as useful as me!


