

Friday Thoughts
7k came quickly / Mapping the SPX ahead / Macro D Thoughts

What a week. Let’s take stock of where we are. While I was considering the possibility of a further extension of the equity rally last week (see tweet below), I didn’t think we would get there without a peace deal, and yet, here we are.
The SPX hit a fresh all-time high on Wednesday, closing above 7,000 for the first time. After falling nearly 10% from its January peak into late March — deep enough to qualify as a textbook correction — the index has roared back more than 10% in two weeks. The Nasdaq has gone from oversold to overbought in just 11 trading sessions, the fastest such swing in data going back to the early 1980s. Whether this is the beginning of a durable new leg higher or the market front-running a peace deal that doesn’t yet exist is the question that matters.
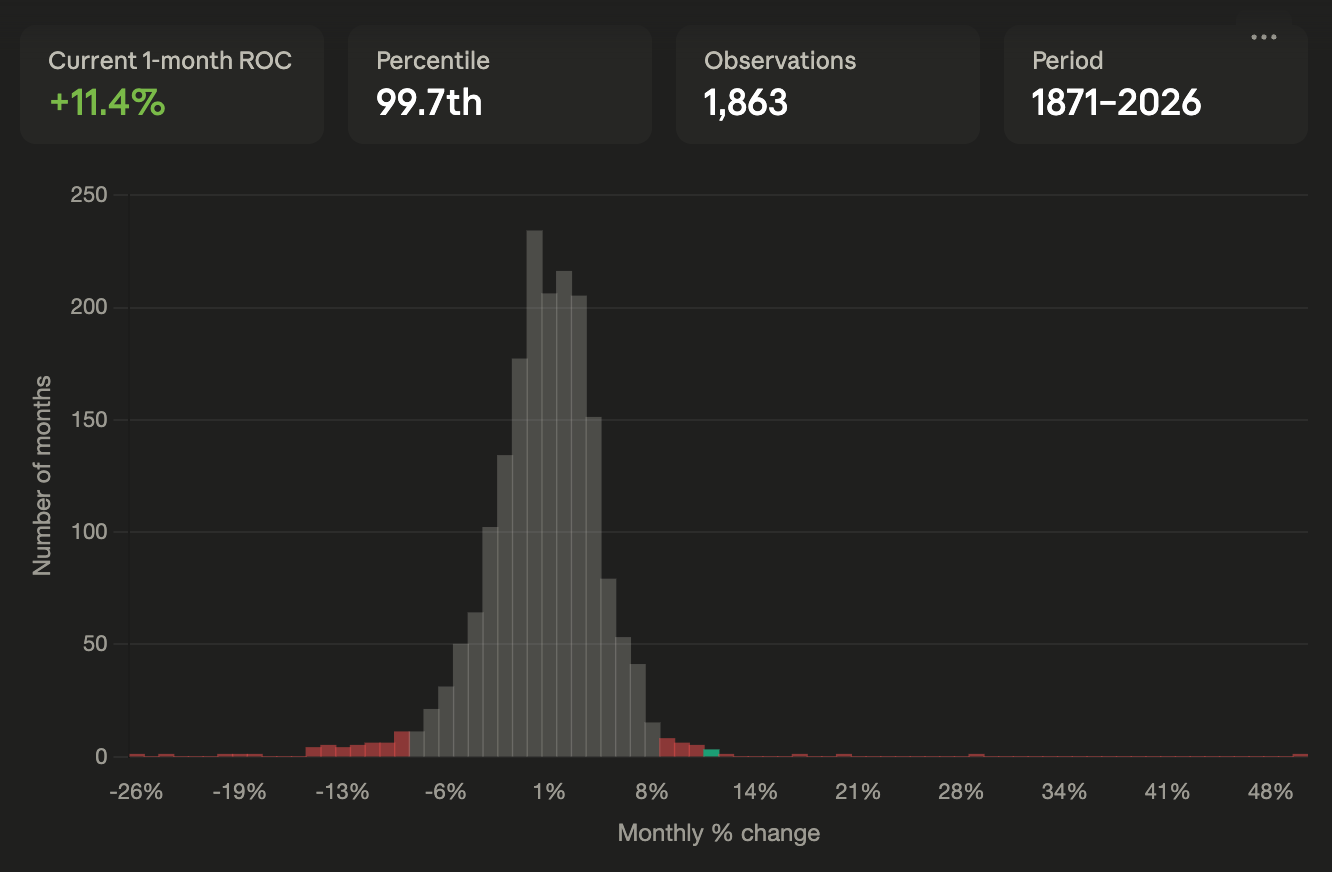
The current move sits firmly in the extreme right tail. Of the 13 prior instances, the majority occurred at major secular turning points — bottoms of bear markets or the end of geopolitical crises. The question, as always, is whether this is 2009 (launch of a durable new uptrend) or late 1932 (violent counter-rally within a longer bear market).
What’s driving it? Hope with a sprinkle of forced buying and short covering. The ceasefire headlines out of the Middle East, however fragile, unleashed the most aggressive short-covering in a decade. Hedge funds flipped from eight straight weeks of net selling to net buying. Systematic trend followers ploughed billions back into equities. The mechanical bid was enormous, and it fed on itself. But strip away the positioning unwind and what you’re left with is a market trading at all-time highs on the assumption that a war is over when, in reality, we don’t even have a framework for peace. The Islamabad talks produced handshakes but no deal. Iran still controls the Strait of Hormuz. Brent is sitting around $97 after swinging violently in both directions this week. Trump says the war is ‘very close to over.’ Iran says it won. Neither statement inspires much confidence in a lasting resolution.
Meanwhile, the IMF dropped its Spring World Economic Outlook this week, and the title alone tells you everything: ‘Global Economy in the Shadow of War.’ Global growth has been cut to 3.1% for 2026, with downside risks dominating. Headline inflation forecasts have been revised up. Under their adverse scenario — a longer conflict and sustained high energy prices — growth falls to 2.5%, and inflation hits 5.4%. Under the severe scenario, we’re looking at 2% growth and inflation above 6%. Those aren’t fringe outcomes. They’re plausible tail risks sitting right there in the IMF’s own scenario analysis.
The IMF’s Article IV consultation with the US was equally pointed. The Executive Board was blunt: there is little room to cut interest rates in 2026. Monetary policy easing would be appropriate only if the labour market deteriorates materially and inflationary pressures decline. In other words, the bar for cuts is high and getting higher. Core PCE sat at 2.9% in 2025 and has barely budged. Energy prices remain the wildcard. The Fed funds rate is projected to go from 3.6% to 3.4% this year — that’s barely one cut’s worth of easing for the entire calendar year. The message is clear: patience, not panic. The IMF’s Georgieva put it well when she advised central banks with strong credibility to ‘look before you leap’ rather than react aggressively to what might still prove to be a transitory supply shock.
This is where it all connects. We have an equity market pricing in the best-case scenario — war over, oil back down, Fed cutting — while the macro institutions are telling you the risks are skewed firmly to the downside. The IMF is calling for patience on rates. Oil remains structurally elevated. The ceasefire is armed, not assured. And yet here we are, at all-time highs.
I’m not saying the market is wrong. Markets have a remarkable ability to discount turning points before they arrive — after all, the stock market bottomed in May 1942, months before troops were deployed in major theatres. There’s historical precedent for this. But there’s also historical precedent for markets front-running a resolution that never comes, and the subsequent repricing is not gentle.
The earnings backdrop does offer genuine support. Consensus expects 12% year-on-year EPS growth for the S&P this quarter, with Tech delivering 45% growth and accounting for nearly 90% of the index’s total earnings expansion. AI investment spending is estimated to drive about 40% of full-year S&P earnings growth. The micro keeps getting stronger even as the macro remains deeply unresolved. That tension is the story of this market right now.
Our momentum dashboard confirmed the turn last week. In addition, our asset allocation model flipped to long bonds this week, another timely signal forming our more bullish stance for now. There is, however, little time to rest on our laurels as we are firmly focused on the path ahead. The dashboard has already shown some reads that are giving us clues about what’s going to transform next. Behind the paywall, I present a framework I apply to the SPX to map out scenarios for the journey ahead.
For all new subscribers or those considering joining the pack, the dedicated technical macro offering on pa-globalmacro.com is now available as either an add-on to your current subscription or as a standalone plan directly on the site. Everything you know and love stays right here — the regular publications, thought pieces, and educational content aren’t going anywhere.
Also, a reminder that you can use my trading models in TradingView scripts, which I made available for subscribers to use on their charts. This is not free and also incurs an additional cost. These are the momentum, reversal, and intra-day models I often reference. If you are interested, ping me an email with your TV username. Note that only paying subscribers will be granted access. No exceptions.
Let’s now picture the likely roadmap for the SPX as it presents itself before we hear Macro D’s latest thoughts for the week.
Have a great weekend.
