Friday Paper Round
May 19, 2023
We are back on the Friday schedule. Well, it is getting a bit more exciting. Stocks seem to be willing to break out. Bonds are re-pricing a possible June Fed hike scenario which is now around 30-40% probability which I think is fair given current macro trajectories. Animal spirits are back in vogue.
Before we dig into some exciting charts, I wanted to present some good work from the excellent macro gang at GS macro strats.
They took three risk-free and three risky assets to analyse implied recession probabilities. See below.
It would appear that only Oil is implying a more significant degree of economic downturn compared to other markets. Interestingly, the European front-end is most bullish given current trajectories. So, if you have your own probabilities and you are very bearish, take your pick in terms of what you want to trade.
Now let’s dig in:
ES, breakie-breakie. Finally, we have some resolution from the recent lull. Higher it is and would appear a break from the recent range. The model got it right so far, much to my annoyance. It, however, is also flashing a first overbought signal which urges caution. This usually does not mean a reversal from the prevailing trend.
NQ, is also flashing as overbought with already the second signal in place. In full trading mode, the model would typically reduce position by 50% or 75%.
Nikkei, which I highlighted on several occasions had a nice run. Again, some overbought signals are flashing here. Nothing dramatic but a pause is warranted.
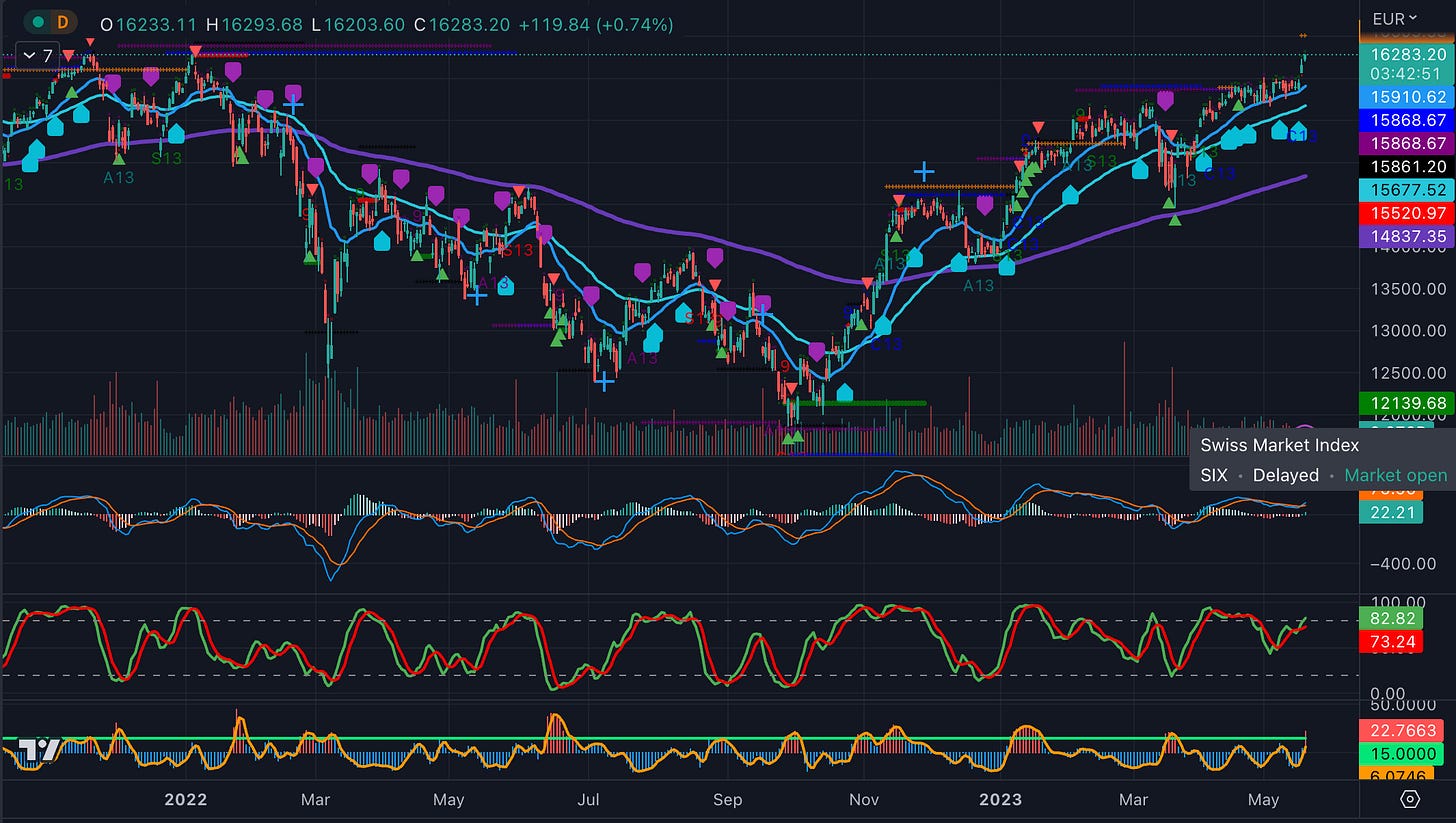
DAX, also knocking on heaven’s door. Again, overbought signal flashing.
KRE, US regional banks. The model still wants to short it despite the recent rebound.
China H-shares. Doesn’t look fantastic and the model is short.
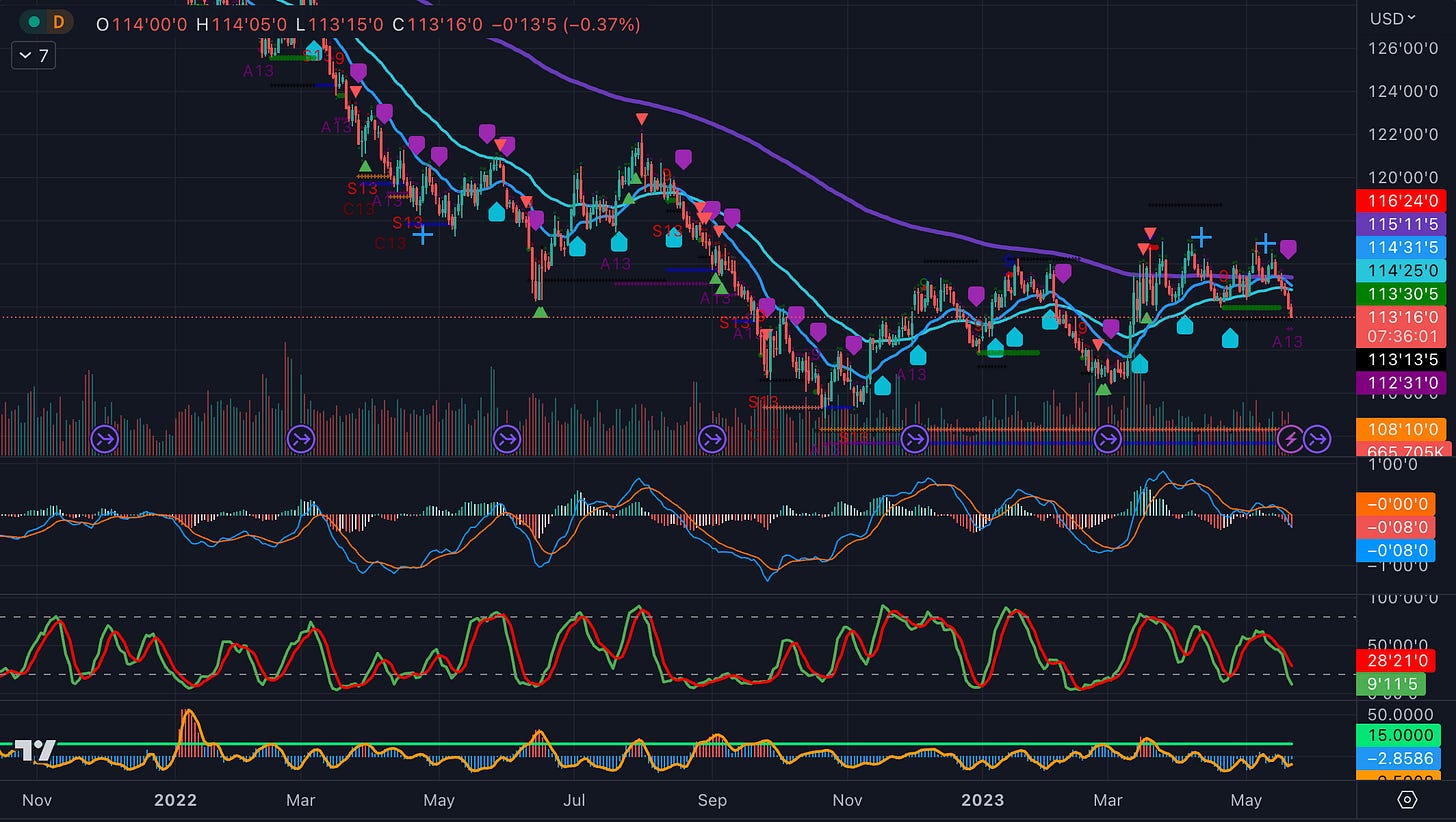
ZN-Future. The model has shot a short. after closing the long about a week ago. Let’s see how far this goes.
ZT (2-year). A similar picture as the model took a short recently.
Gilt Futures (10y). I flagged this earlier this week in a tweet. We’re back at recent lows. Good set-up while the model wants to short it.
US 2-10s. Curve. Le model has gone short, meaning more flattening. Interesting but unsurprising given recent front-end bashing.
US 5-30s. Paper’s favourite steepening expression is also seeing a lot of pressure. Now sitting on the 50-day average.
GBP/USD. The model has no position after closing out the recent long. We’re sitting on the 50-day now waiting for the next move.
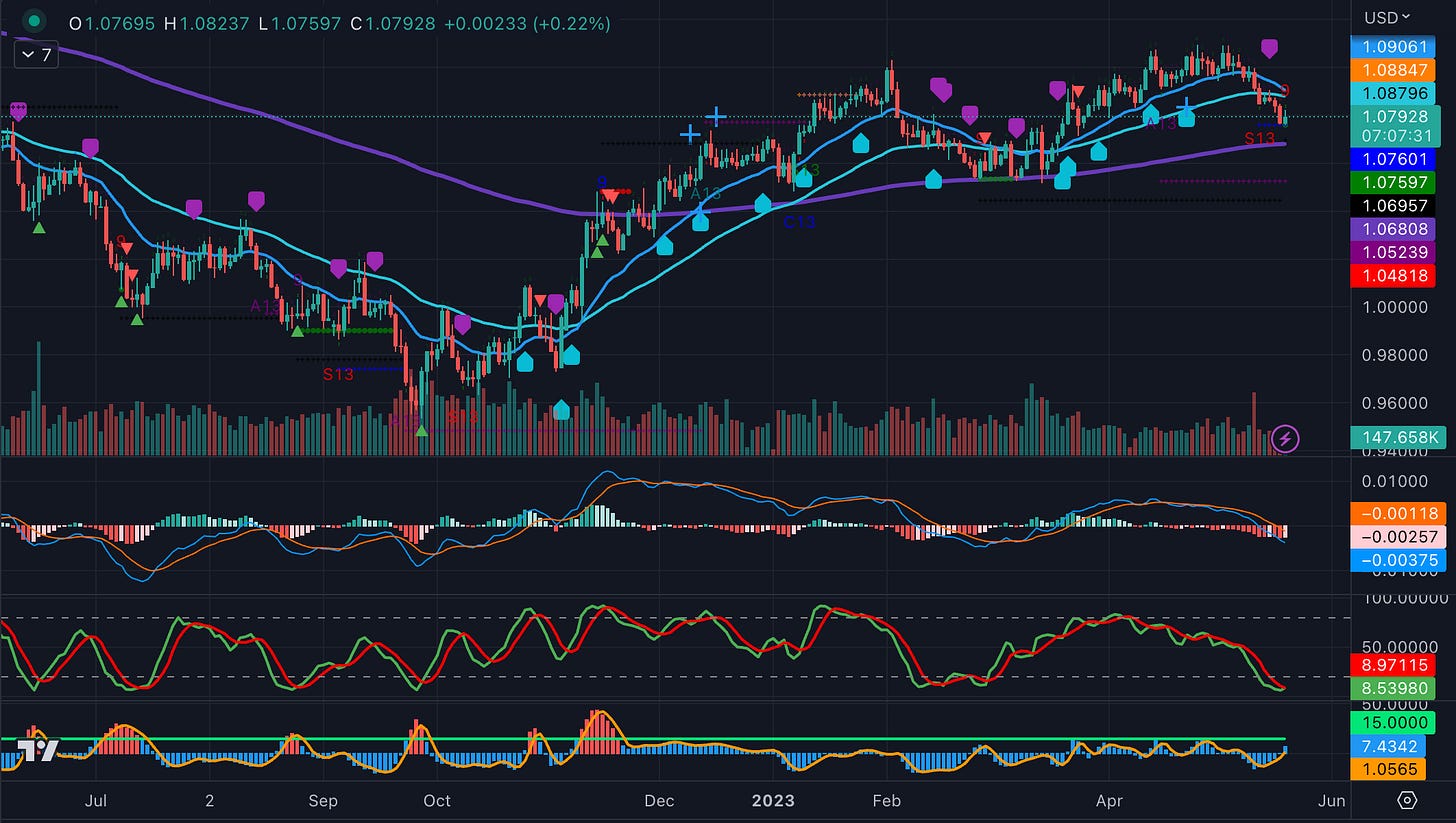
EUR/USD, meanwhile, the model wants to short the pair. I’m less certain. Other indicators are angling for a long. TD is showing a buy set up and some oscillators are also willing to nibble at it.
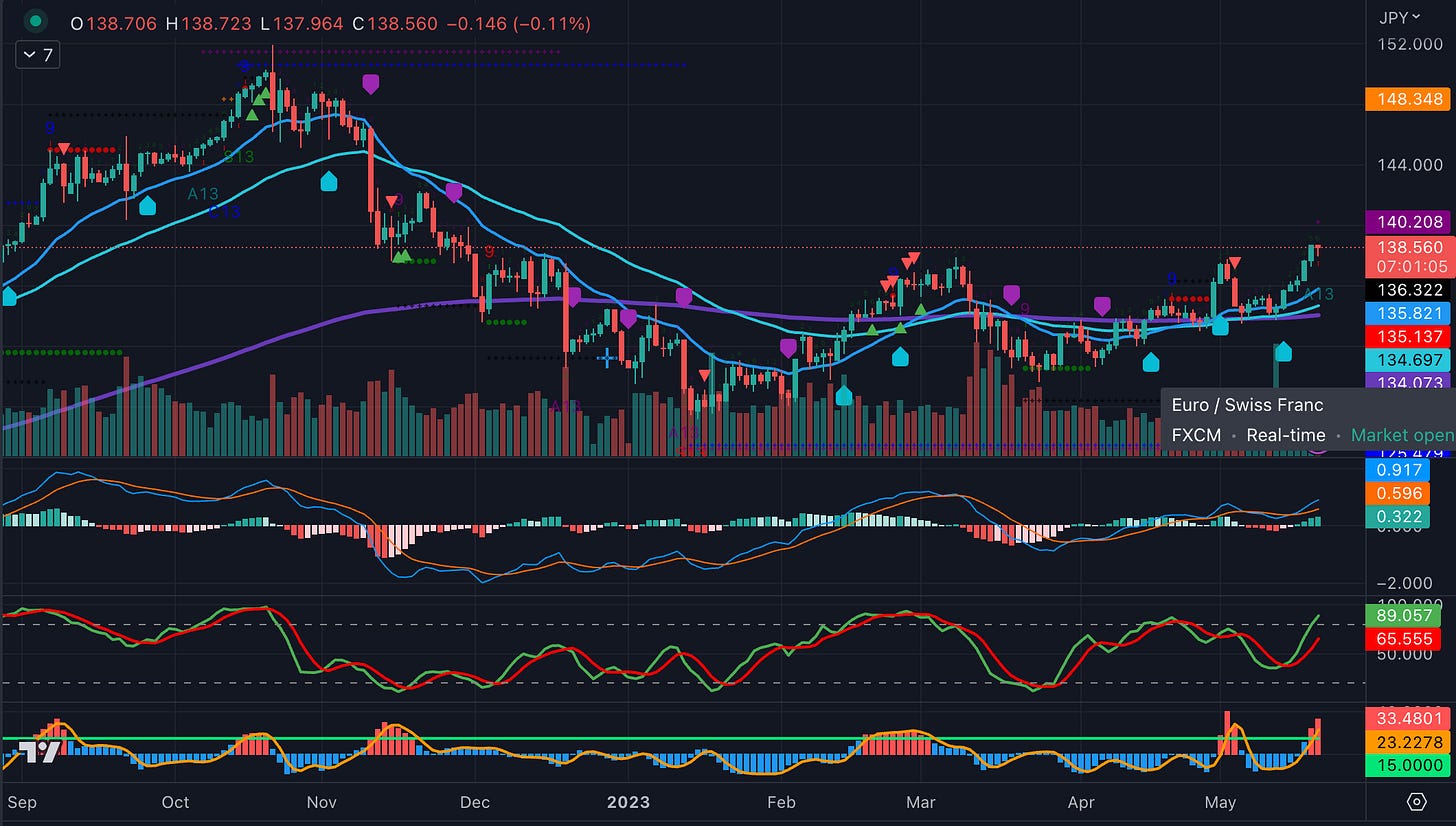
USD/JPY. Nice push higher in line with the sell-off in rates. Overbought signal flashing though. Re-load on the break-out?
USD/ZAR. Oh boy. The model wanted it higher and it got it. The overbought signals went flashing and we had a small relief just to load higher. This is a good illustration of how the overbought/sold indicators just highlight reversal potential but not often the reversal of the primary trend itself.
Gold, ay carramba! The model just took a stab at being short. It might have missed a good drawdown first but it’s not here to react too early. It is in line with the short in rates and the reversal in USD weakness.
Natgas, the model went long before the break higher. Now we have some overbought signals flashing.
That’s enough for today. As always, appreciate the comments. Hope you find it useful!
Your
Paper Alfa


Very much appreciate the info offered as well as the low key approach. Many bon Fintwit become histrionic or strident and there is no call for that. I suppose though, it is not a time yet https://www.youtube.com/watch?v=xt3DEuw0wjM