Friday Paper Round
June 16, 2023, added Tracker
We are back with a vengeance. What a week this has been. CPI, FOMC and many other data points couldn’t stand in the way of the prevailing trends. I sense a ton of head-banging (not the musical kind) regarding the continued bullish market disposition, myself included.
It is challenging to build your outlooks and strategies based on pre-determined blueprints. Regardless of whether you look purely at economic outcomes, liquidity or some sort of cross-asset valuations.
Financial markets are dynamic, adaptive and multi-layered complex systems. Attacking it with one simple method is difficult as it will change its colours frequently. Sometimes, certain narratives and themes are prevalent and take a long time to digest. Last year, was certainly one of those dynamics where the inflation narrative dominated for the entire year. I am strongly motivated to analyse those narratives and track whether they are in play.
Easier said than done, but you can look at overall sentiment, certain market-related pricing, including options as well as Google searches on a topic or theme. Fintwit in itself is also very powerful when analysing prevailing opinions and narratives. I am also currently exploring how to get Twitter sentiment data into a tradeable signal, stay tuned.
Going briefly back to sentiment, we can look at Semiconductors, for example, and ascertain, via charts, the index’s relative strength to the overall market.
This is from my friends at Unifinanz who do in-depth analysis across many sectors and time frames.
You see the monthly candles as well as the 10,20 and 40-month Bollinger bands (also my preferred longer-term analysis tool).
In the lower charts, you will find the index’s relative strength to MSCI World, DJ US Technology, DJ US Software and the Global IT sector.
You can see how the setback from the 2020 highs did not alter the longer-term picture. Relative strength, however, has now reached another peak so some profit-taking is likely but will again offer an opportunity to accumulate in my opinion.
Now, let’s go straight to our Paper charts. Further below we also track the signal’s outcomes on a week-to-week basis.
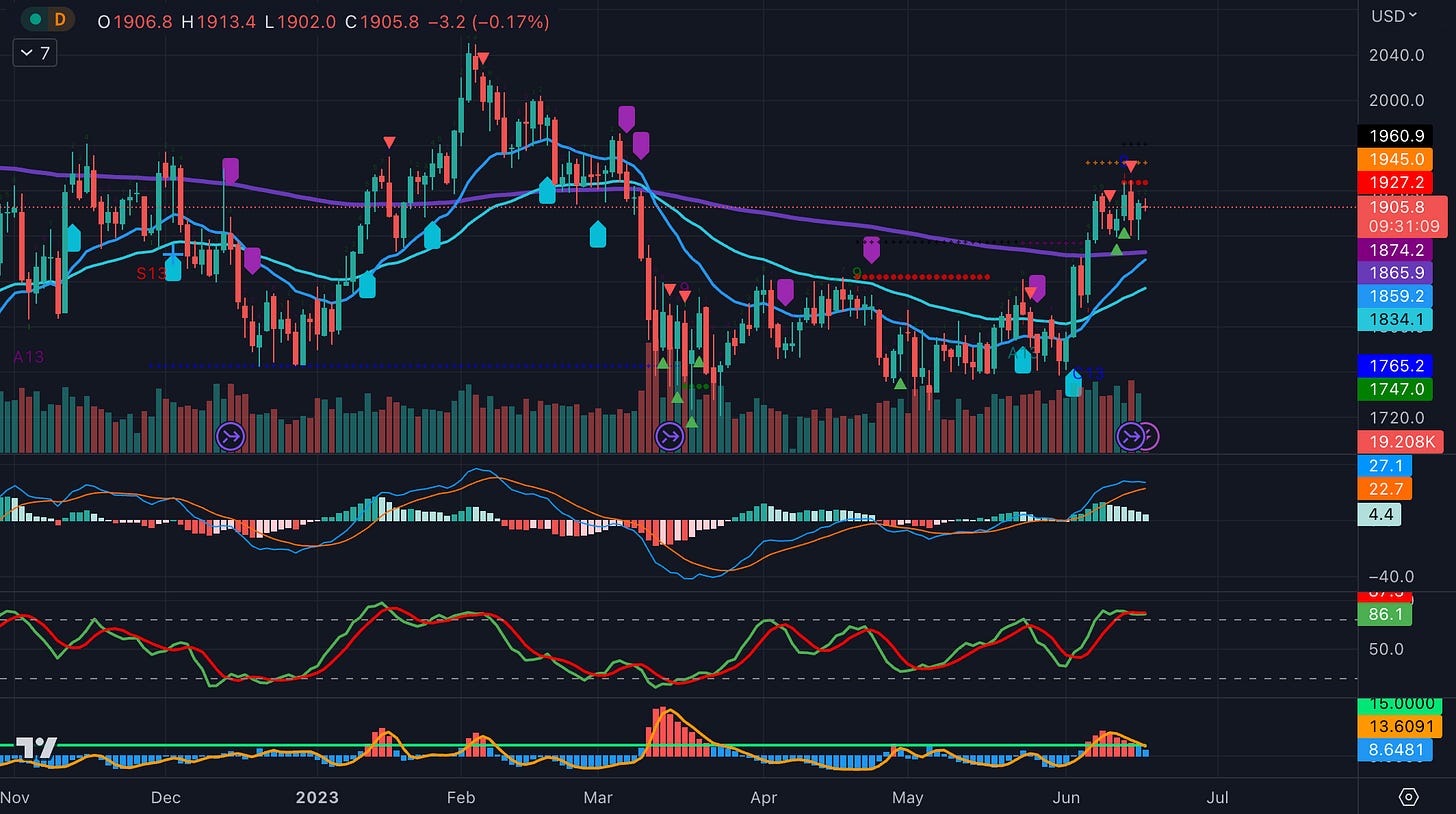
ES, is relentless, to say the least. Even though the model is still long the overbought flashing signals have been mostly ignored.
NQ, the model added another unit over the week. The chart looks scary and overextended, yet no reversal signs are flashing here.
Russell, while the model nicely bought the most recent pump, flashing signals have damped the recent rally. Can we resume the uptrend?
FTSE (UK), is continuing showing relative weakness. The index’s correlation with a weaker GBP (which has strengthened) might be a factor. Nevertheless, the model is short and we are coming back from touching 50-day lines today.
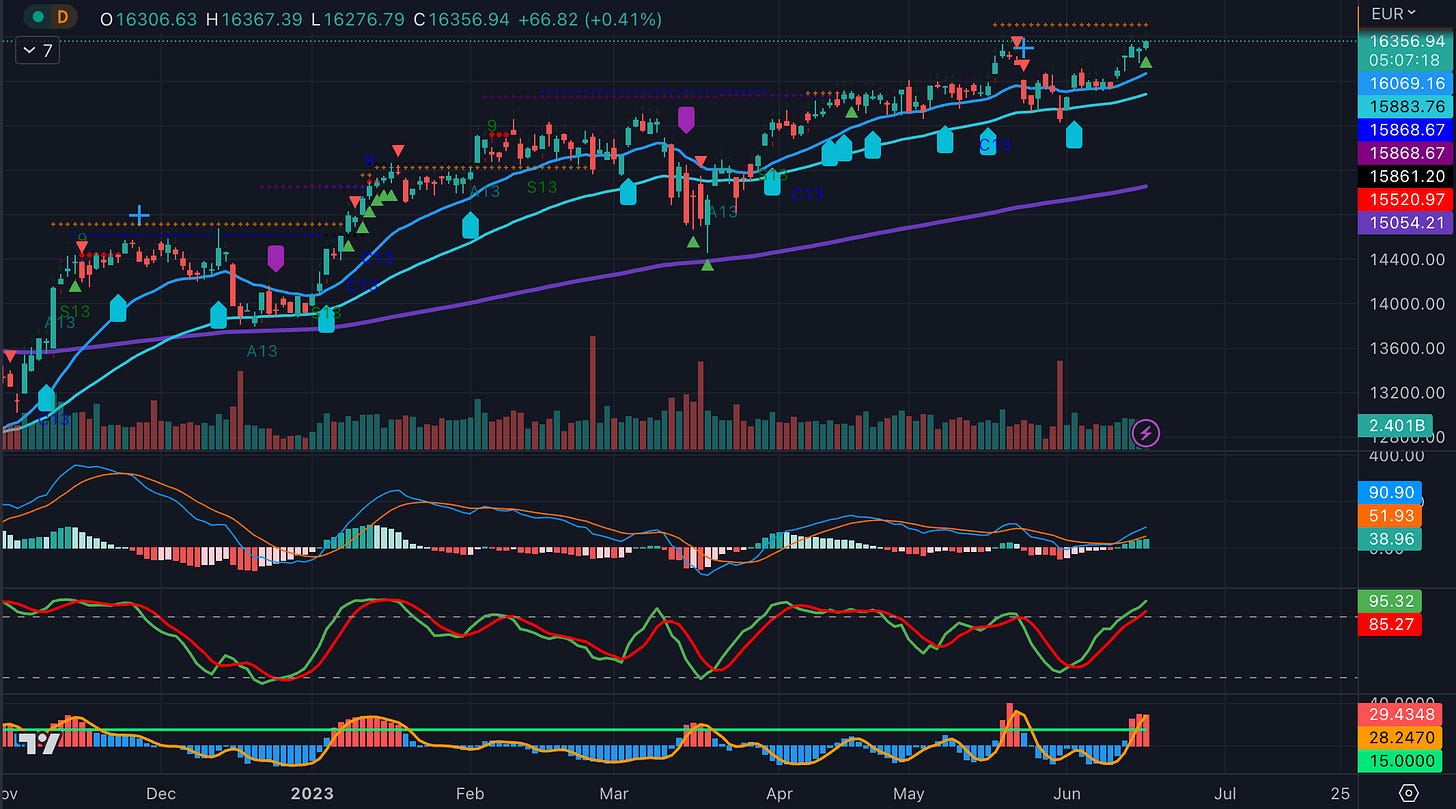
DAX,is continuing the party. While we are knocking on recent highs we are flashing red on overbought signals.
Hang-Seng, we’re back. The model has flipped its short into a long position today.
ZN, is bouncing from a very short-lived reversal signal. The model is still short.
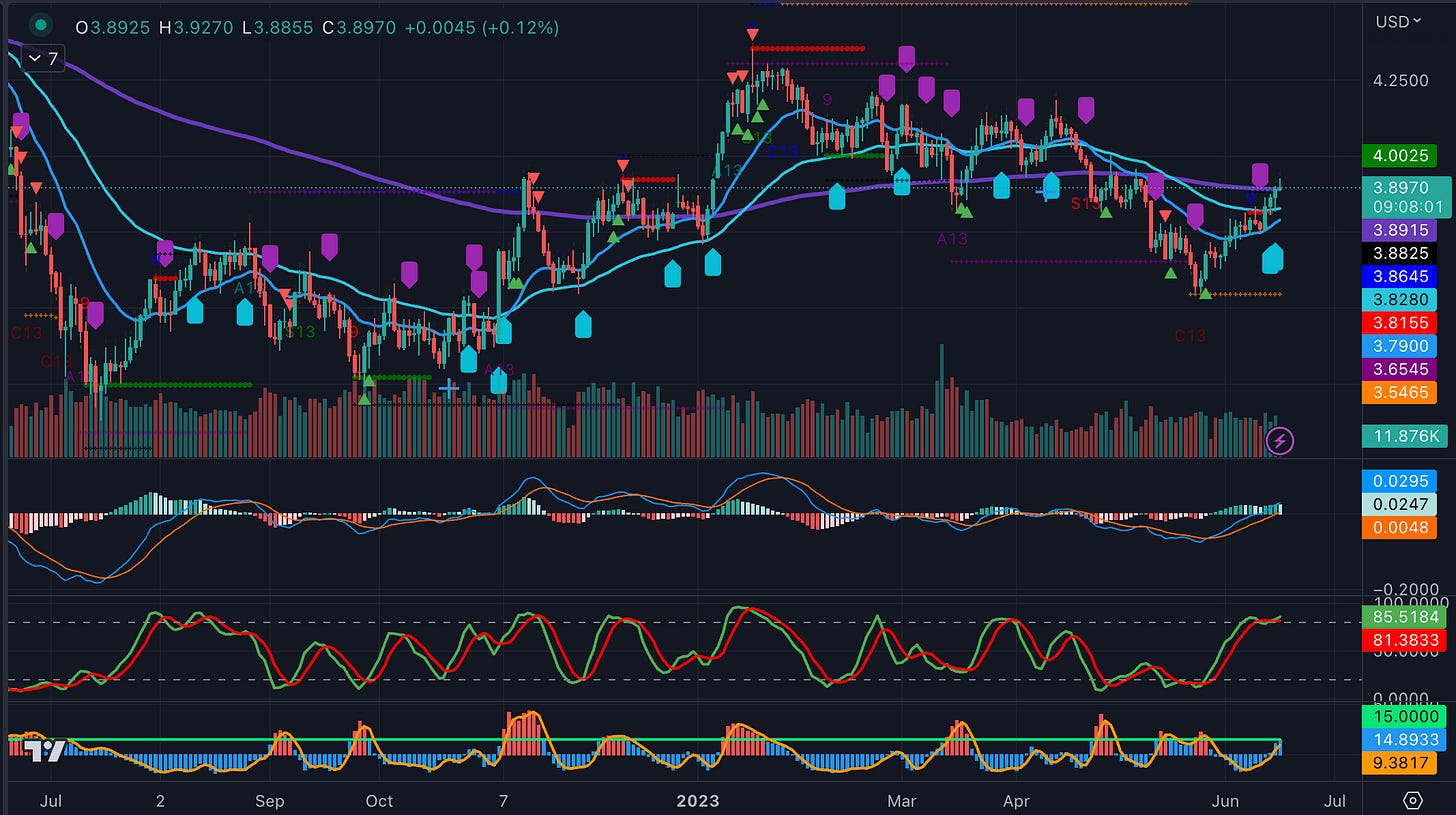
Bund, seems to be attempting to find a bottom at very important levels. Can we bounce with the ECB behind us?
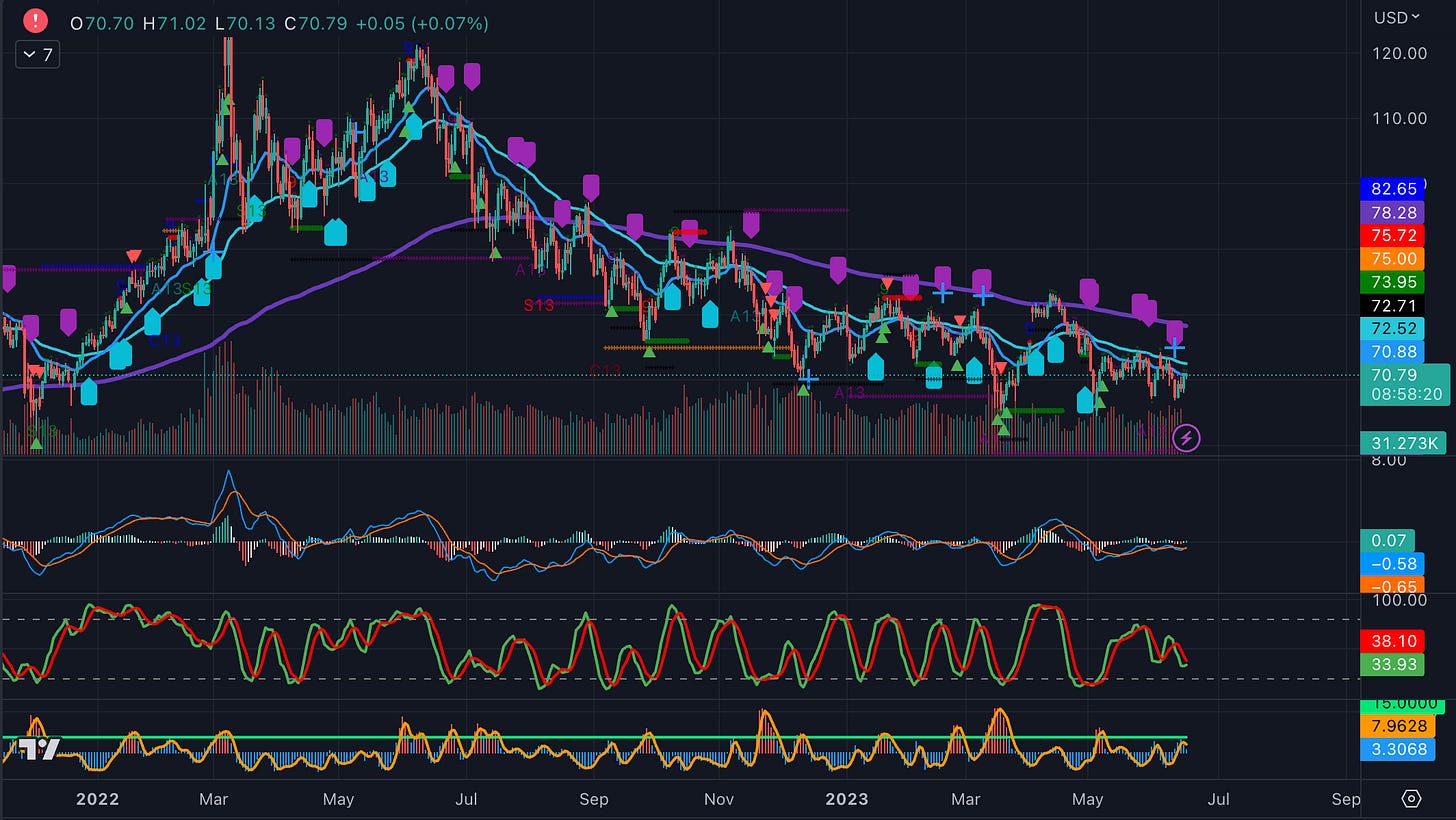
XLE, the model is caught in a short circuit here, switching from short to long in short order. It would seem to be a noisy market for now but certainly is worth keeping an eye on.
Gold, the model still doesn’t like this precious-looking metal but has flagged an oversold condition which is now in play.
Silver, similarly the model is short and just recently added to its position.
Copper, the model seems like some switching this week and has moved to long.
BTC/USD, the model is still short although we are hanging by a thread around that 200-day which seems to be a strong support for now. Is BTC a good canary for risk assets in the coming months?
GBP/USD. The strong USD theme has definitely got another knock this week. This has also triggered a buy with regard to the model.
EUR/USD, yup same here.
Meanwhile, USD/JPY, looks like it’s poised to trade higher. Watch this space.
Crude, the model has taken profit on the short for now.
Signal Check
As highlighted last week, I have started tracking the performance of the signal. Given that I just want to know whether it’s done well or not, I am simply looking at success or fail rates and disregard any major extent of the move as it would require some nuanced adjustment in position sizing.
I will explore this possibility in subsequent posts. For now, let’s just check the signal’s primary directional quality.
For this first week, we have the following results:
5 hits and 5 misses. Again, I haven’t measured the extent of either the gains or the misses as we’re looking purely at the signal.
Let’s see how we fair next week after flipping two positions, namely Copper from short to long and EUR/USD short to long while closing out a winning trade in shorting Oil.
Yours,
Paper Alfa
Music
Last week’s rock and metal retreat was a success although very tiring. It’s amazing how friendly and supportive the Metal family is. There was not one thing of negativity within the 120k-strong crowd. Just amazing. The food, however, was way below par. I am still recovering but I will surely be back next year.
Little did I know that Metallica was playing their 2004 Download gigs without their resident drummer Lars Ulrich who fell ill just hours before they were meant to mount the stage.
Luckily, talented drummers from other bands such as Slayer and Slipknot stepped in to support the bongos from the back. Heck, even the band’s drum technician had a go with one of the songs.
It is truly one big metal family.


Always welcome and well done. Lucky you to see Slipknot-an old favorite: https://www.youtube.com/watch?v=LXEKuttVRIo
Love it 🔥