Friday Paper Charts
January 5th, 2024
The new year has started in earnest. In this week’s Attack the Week (ATW), I wrote how I let at least the first few weeks of the year pass by without engaging in much of an investment activity. I do this foremost to observe price action as new narratives are trying to establish themselves. I am also doing it in order to rid myself of past biases that sneak up on us. It’s not easy to look at the below table and not be enticed to allocate to some assets in the upper table. So, have one last look at 2023 performance and corresponding sharpe ratios. You see it? Now, forget about it.
In last week’s Friday’s Paper Charts, I noted an exhaustive pattern in Bonds, with the momentum model taking profit on being long 30-year US treasuries (UB or TLT) after going long at the beginning of November. This also coincided with exhaustion patterns on USD weakness plays. The model also took profit on being long NQ, which was rather timely.
Since then, we had a decent backup in yields. The table below shows the spot and forward curves for USD swaps. A small steepening bias caused yields to sell off an average of 15 bps over the past week. We still have payrolls today, which could significantly impact the week, of course. Still, as of now, the Goldilocks scenario is certainly being challenged, with bonds erasing pretty much all of the post-FOMC rally over into year-end.
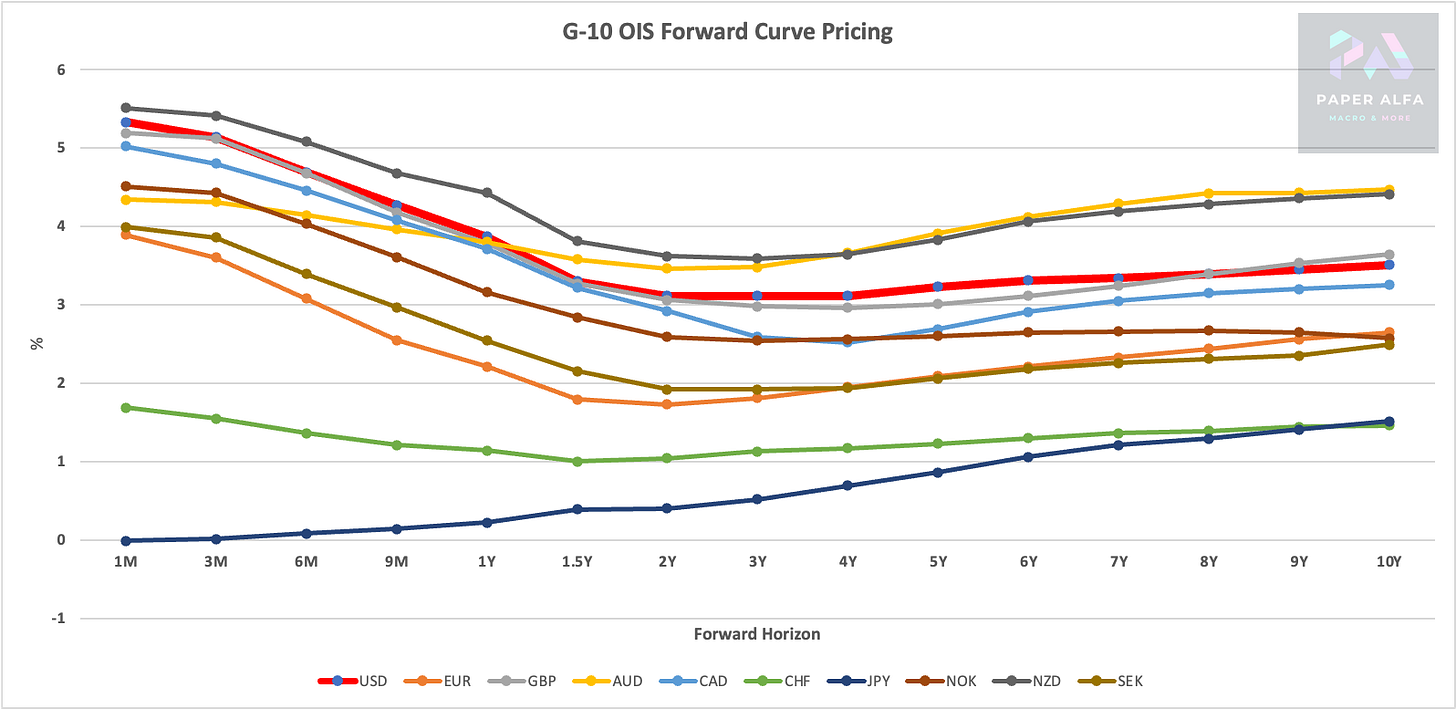
The below shows the current STIR pricing for G-10 countries. The fat red line is the US, where terminal rates are still showing north of 3%. This is a topic for a separate post, but even in the FOMC’s books, the neutral rate is still around 2.5%, which implies still a somewhat restrictive policy pricing in forward space. This should still be good news for bond bulls, who can easily argue that the current backdrop should give way for the Fed to return to a looser policy setting.
Let’s now plough straight into the avalanche of charts awaiting us today. We are covering Equity Indices, Sectors, Single Name Stocks, Cross-Market ETFs, Rates, Curves, FX, Commodities & Crypto. The whole spectrum, really, and I will be adding more. If you are curious, I have opened up the possibility of signing up for a 7-day free trial; why not check it out?
As a reminder to all new subscribers and those needing a refresher, check out a comprehensive full model guide here.
Let’s go!


