Friday Chart Book
June 14, 2024
What a turbulent week this was. If you are solely looking at US stocks, however, you might have missed a beat. Bonds have retraced all of last week’s NFP sell-off and more. Our models have been long bonds throughout this and are continuing to press the buy button, also now switching to a long in German bonds, which are continuing to press lower in yields. See the updated charts below for the full picture. Trends are forming and my models want to capture those early.
Geopolitical risk is now back to the forefront around the world. We are almost halfway through this year, and the experience of the past fortnight is instructive for thinking about the impact of the major elections remaining this year, most notably the US Presidential election. I will publish a thought piece on the US election soon.
While we saw markets react violently to the Indian and Mexican election results, political fall-out has now also been felt in Europe following the parliamentary elections. Traditionally political stability and institutional quality has been more of a concern in developing countries and that’s why there is a risk premium in emerging markets assets and currencies.
European markets experienced a sell-off during the week due to increased risk and uncertainty, primarily driven by President Macron's decision to hold snap legislative elections in July. This move has heightened concerns about the growing influence of Ms. Le Pen and her party, the Rassemblement National, which is currently polling ahead of Macron's party.
These market worries extend beyond potential changes in tax rates or tighter regulations. They also encompass fears about the weakening of political norms and institutional integrity in France and across the EU. Consequently, French equities and bonds have come under pressure, and the spread between French and German government bonds has widened. Macron's high-risk strategy could have significant and far-reaching consequences.
France vs German yield spread
CaC-40
We have to be more vigilant about political risks going forward. This is normally a major focus of mine but I will incorporate it to benefit our overall decision making and my readers. Potential structural political and institutional shifts have to be incorporated in our trading decisions. Financial stability, capital flows and hence prospective returns can only blossom under the spectre of high-quality governmental decision-making and independent macro policy institutions.
Let’s now hear the thoughts of my friend Macro D who analyses this week’s FOMC meeting and incoming data in more detail.
Thoughts by Macro D
“There is nothing stronger than those two fighters over there: time and patience.”
LEV TOLSTOJ
There's always a before Jay and then an after Jay.
This is the before Jay.
At the start of the week, I wondered, "Will this be a big Wednesday[1]?"
After last Friday's US jobs report, which dashed hopes that cuts would kick in after the summer, inflation data was on my (and not only my) radar.
To recap: According to data from the Department of Labor's Bureau of Labor Statistics, nonfarm payrolls increased by 272,000 in May, up from April's figure of 165,000, while job openings fell from 8.355 million to 8.059 million.
But where's the truth?
I believe that the latest jobs report was "strong" only because more people are working part-time jobs, so the job growth numbers are inflated. At the same time, however, the number of full-time job holders is decreasing, and the unemployment rate is increasing. Based on these considerations, the question is:
Is the labour market to be considered weak or strong?
Let's consider swimming in a financial world in which every participant deludes himself into knowing everything about everyone. Jay is well aware of the data he has before his eyes. The markets, in turn, are mindful that Jay knows the reality perfectly.
Unfortunately, I do not know anything, so what did I do?
I focused more on the unemployment rate, which rose to 4% in May compared to 3.9% in April. Considering that a year ago, the unemployment rate was 3.4%, I read in these data a dangerous worsening, but then I got to asking myself.
Is the labour market going bad?
Until Tuesday afternoon, my thoughts on the near future were aligned: the policy rate was unchanged at 5.25%, and the unemployment rate was falling. At the same time, I could not orient myself on inflation since the reasons that foreshadowed an increase and those that foreshadowed a decrease were incredibly accurate. As for the dot plot, I expected to see a committee inclined to predict only one cut for 2024.
The last dot plot dated back to March, and this was its portrait:
Three cuts were expected for this year, but today's reality shows us that we are moving in a completely different direction.
As I delved into the FOMC's potential concerns, I found myself pondering, 'What are the needs of the FOMC? What does the committee see?' This question would guide my analysis.
Answer: "The labour market seems (here, I repeat SEEMS) to proceed without a hitch. Therefore the orientation (considering the May payroll report) will be in favour of a hawkish approach, and the dot plots should show only one cut for the rest of the year.
Following the May FOMC meeting, however, the JOLTS report suggested a cooling of the labor market. At the same time, employment strengthened compared to April, while wage inflation increased. Some GDP indicators left us hopeful that the second quarter's growth would exceed that of the first quarter.
In short, the signals were at odds with each other. When the preamble to a monetary policy meeting is based on such different signals, it is clear that you are heading towards an event that only Tiresias[2] could accurately predict.
I was still there with my questions: What will the committee worry about?
"That inflation accelerates again, and that labour market suddenly slows down, forcing Jay to hit the airbag of unvarnished reality."
What are Jay's intentions in this scenario?
"He wants proof that inflation is not preparing to climb Mont Blanc again, and so he will pay particular attention to the data, but only if the data is willing to play along with his particular dialectical and expository needs".
In the meantime, I was passing the time by looking at my dear Old Europe and those who, despite being entirely within the European courtyard a few years ago, preferred to greet the rest of the group by exclaiming, "I play better alone". In the United Kingdom, unemployment is 4.4%, and wage growth is still relatively high. Consequences? Since unemployment has been at its highest in over two and a half years, I found myself forced to think that the sale of scissors has just been banned in the City. In any case, even if scissors were put on sale, Andrew Bailey would not order his secretary to get him a brand-new pair.
With my focus now on Japan, I couldn't ignore the first quarter data that confirmed the country's economic contraction and the fragility of its consumption. This poses a significant challenge for Professor Ueda, who is striving to balance his monetary policy. He needs to tighten it, but without stifling growth.
The weekly ride.
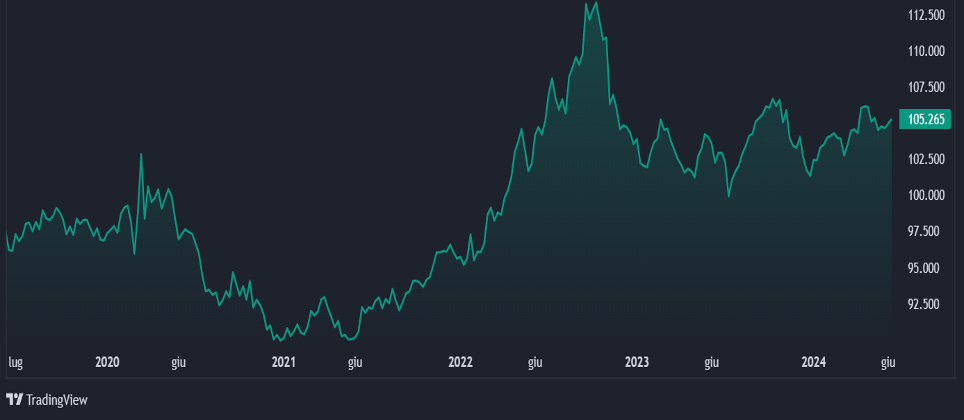
Between Monday and Tuesday, the dollar rose to a new year-high, based on the assumption that Wednesday's US inflation data and the Federal Reserve's policy decision would increase demand.
DXY Chart
Wednesday:
Earlier in the day, I was writhing around the question, "Will the inflation numbers or Jay's next words drive the markets?" or "Will the inflation numbers be clear and forceful enough that Powell’s statements will have to ride on the back of the inflation numbers?" Who will pull the wagon forward?
Amidst these musings, a tantalizing hypothesis clung to the fringes of my thoughts, one that seemed improbable yet held a certain allure. Which one, you ask?
The FOMC’s veiled suggestion of a rate hike loomed over the horizon, a harbinger of change. Should this come to pass, a deluge of fresh capital would flood into the States, propelling asset prices skyward, and leaving the currencies of nations with weaker rates in its wake. Europe, it seemed, was destined to be thrust back into the heart of the storm.
Just before the inflation numbers, I returned to the charge:
"But if we enter a rate-cutting cycle, what cycle is this hypothetical rate-cut part of?"
I mean, I was usually inclined to see the Fed cutting rates in an environment of economic weakness, but this time, it seems that the Fed is forced to cut in a context of economic strength.
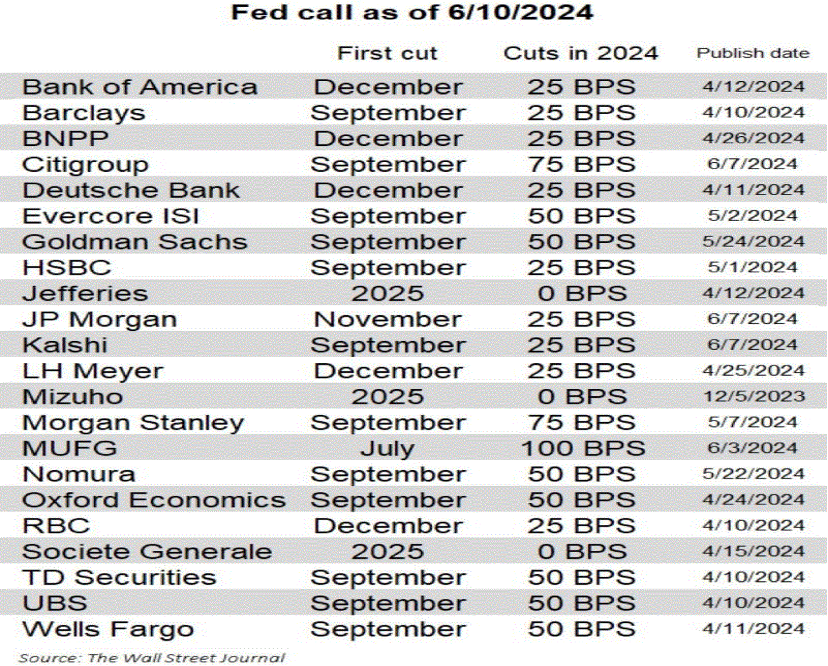
While waiting for the big event, I took a look at the forecasts for future interest rate cuts:
In the meantime, these were my sterile predictions:
Confirmation of a solid restrictive stance, i.e. less dove and more hawk
Higher interest rates for a more extended period.
Wednesday’s CPI print:
And now, the unexpected twist: The consumer price index takes a dip, falling below concenus forecast. This surprise development could be seen as a red rose, a hopeful sign for Federal Reserve officials who are eagerly seeking signals that might prompt a reduction in interest rates. It is known that the point of observation always determines the aftertaste (sweet or bitter) of the horizon that looms before our eyes. Even the inflationary horizon can be reached from different observation points. We can consider the latest inflation data by emphasizing its slowdown compared to the 2022 highs, but at the same time, we can also recognize that we have now arrived at the thirty-eighth month in which inflation has managed to remain above 3% (therefore, well above the Fed's target).
The decline in energy prices, especially gasoline, was more than offset by housing prices (the critical category of the services-related inflation component). At this point, the May report revives hopes of a rate cut in September and Fed Funds futures price in a rate cut within that month with an 80% probability (less than 60% before the CPI report).
Was I expecting an immediate cut from Jay at this point in the day? No.
However, to convince the American central bank, further confirmation of the disinflationary process will be needed. What kind? The following key appointment will be June 28 with the core PCE deflator, the Fed's preferred inflation indicator.
As the inflation data unfolds, it raises a crucial question: 'What if this is the symptom of an economic slowdown?'. This potential scenario, if confirmed, could have far-reaching implications for the economy and monetary policy decisions.
Below, we see the 10-year trend graph.
We are still in the realm of hypotheses, but given that a rate cut next month still seems remote, the question to ask is, "Could these inflation numbers push down in September?"
At the same time that the inflation data was published, I was convinced that on the other side of the ocean, Lagarde was breathing deeply; it hadn't happened to her in a while.
While waiting for good old Powell to enter the scene, I thought it best to consider a few charts.
This first image reveals a significant economic event in the next 12 months: a staggering 9.3 trillion dollars in US debt securities will mature. The immediate consequence of this could be the widening of the deficit, a potential concern for the economy.
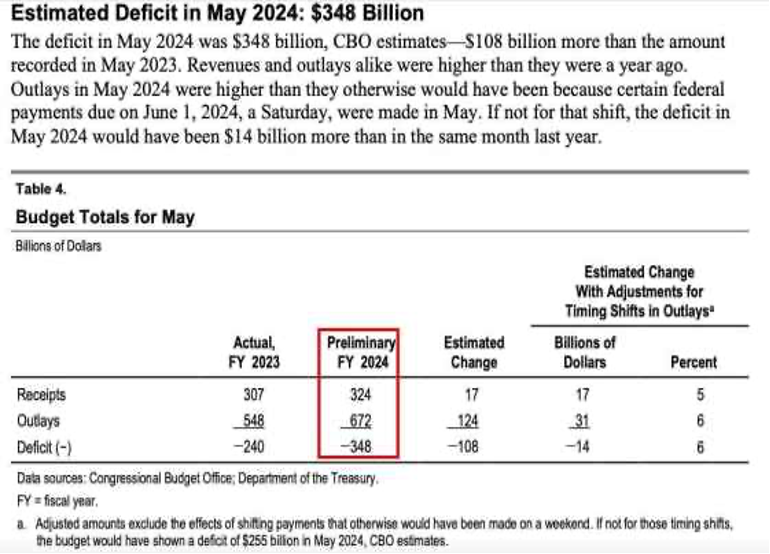
The second chart, a crucial indicator from the US Congressional Budget Office, reveals a significant development. In May, the US economy grappled with a further deficit of a staggering 348 billion dollars.
Well, considering that the elections are upon us, will good old Jay also start talking a few words about this (fat) elephant in the room?
When the moment of truth arrived, the Federal Reserve don’t surprise us and left rates unchanged. This decision, in contrast to their previous predictions of three cuts in March and six at the beginning of the year, suggests a more cautious approach to monetary policy this year.
What does the FOMC think?
The US monetary policy committee does not believe it is appropriate to reduce the target range until it has gained greater confidence that inflation is moving sustainably towards 2%.»
What did Jay say?
«Inflation is still too high. Sure, it has come down from the peak of over 7%, but it is still high, and we want to bring it to 2% ». We will need to see more positive data to bolster our confidence that inflation is moving sustainably toward 2%. Cutting rates too fast or too much could set us back in the fight against inflation, which has fallen over the past year. Currently, the risks to our goals have been balanced, but progress has been modest toward our goal.
The bottom line is that the FOMC believes the economic outlook is uncertain, and the Committee remains very vigilant about inflation risks.
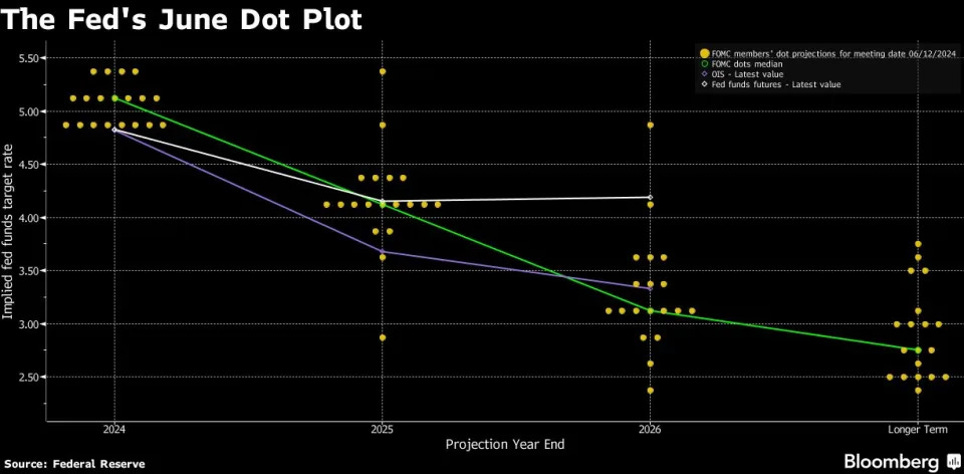
So, this is the final portrait of the dot plot:
The Federal Reserve's dot plot, an essential tool the US Central Bank uses to communicate its interest rate projections, presents a clear picture. The average expectations are for a 2.1% GDP growth by year-end, a 4% unemployment rate, 2.8% core inflation, and a single 25 basis point rate cut. However, it's worth noting that some anticipate two cuts by the end of 2024.
Now, I conclude my report by moving to Australia, where employment rose by 39,700 in May from April, according to the Australian Bureau of Statistics data today, while the market forecast was for a gain of 30,000. Full-time employment, on the other hand, rose to 41,700 after a fragile couple of months. The Australian economy has stalled in the first quarter, with a meagre 0.1% growth as consumers held back spending due to high inflation. The Reserve Bank of Australia is expected to hold interest rates at 4.35% for the fifth consecutive meeting at its next meeting. Inflation in Australia is proving to be a tough nut to crack than expected, and the markets are far from seeing the easing cycle.
[1] Homage to the 1978 movie Big Wednesday directed by John Milius and dedicated to the world of surfing.
[2] He is a seer of Greek mythology, son of Evereus, of the Sparti lineage, and the nymph Chariclo.
We now turn our attention to the charts. By now, most of you will be familiar with the models and their signals. If not, please study the guide I have published.
The full book of 250+ charts covers the whole asset spectrum from equities, bonds, commodities, FX and Crypto to give you the most extensive view. On average, it will generally provide a good 5-10 set-ups on a weekly basis.
A reminder that you can now also use my models in TradingView scripts, which I made available for subscribers to use on their charts for a fee. If you are interested, ping me an email with your TV username. Note that only paying subscribers will be granted access. No exceptions.
Let’s go


