Friday Chart Book
July 26, 2024
What a great this week was. Plenty to ponder and talk about. Please read my Mid-Week Update and the follow-up on Thursday below, which still reflects my thinking. This market isn’t for fools or amateurs, as it can chop you regardless of your views. If in any doubt, stay away. I would also be cautious about listening to people who have no real skin in the game. I have repeated this multiple times, there is unfortunately no filter mechanism to this. People can say a lot of things and whirl around their opinions and trades. Here, we go about our process and provide thoughts, hopefully useful insight and education so you can build up your own framework.
There has to be a method for approaching markets. While I stay away from putting my trade ideas out there, I give you the output of my models and how they are reading the markets. They have been great, but they will also be wrong at times. They were built to give us a good guide as to where we are likely headed, and you can see its full history every week or in the Tradingview Scripts you can use for yourselves. See the details below.
It’s currently all about front-ends, which is driving the current steepening trend. As you can see from the chart below, we are at the start of the cutting cycle. The charts below show the spots and forwards that have already anticipated a good degree of easing ahead. In typical cycles, forwards always underprice the extent of a cutting cycle and a hiking cycle, for that matter. This time around, however, we are not facing a typical cycle; in fact, every cycle has its nuances. The question remains whether we will just see a truncated cycle of a few cuts or something much deeper.
Taking US SOFR forwards, for example, we are currently pricing around 3.75 in 3-5 year ahead terminal rates, implying the average of a more pronounced cutting cycle into a recession of possibly back to 2% and a truncated formation of, say, only 50-75 bps cuts.
Part of the recent excitement to price in a more rapid reaction function, presumably front-running a quicker slowdown and convexity to US growth, has led to even price cuts in a small probability of more than 25 bps in September. Everything is possible, of course, but I think that’s a bit too much too soon.
In option space, a bet on a 50 bps cut (options maturing before FOMC) is giving you a 4/1 payout for such an outcome, indicative that those tail risks are what’s behind the recent bid in bonds.
The matter of fact is, that inflation might indeed be behind us and that the focus is now firmly focused on growth and the strength of the labor market. While there are some tentative slowdown signs, I would say that a few prints don’t make for a trend. The market might get ahead of its skis a bit, as it did after December’s Fed pivot, which ultimately proved to be premature. Are we going to repeat things again?
With increased focus on the labor market and the “Sahm Rule” it is interesting to note that most of the rule’s increase was due to re-entrants into the labor force, which stands out in comparison to previous periods when a downturn was unfolding.
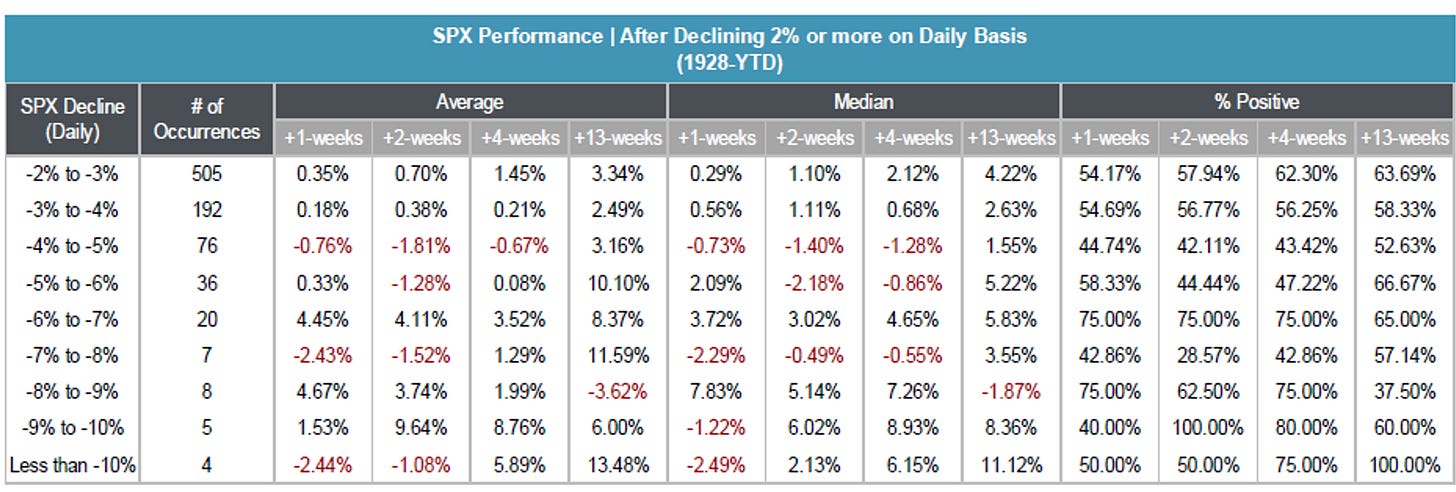
Oh, I forgot the talk of town, equities. It was another ugly week, but our models caught the shorts and reversals in time. What now? The table below gives you a great summary of all the episodes from 1928. A daily decline of 2-3% typically leads to a bit of a rebound on average in the subsequent years. What to make of it? It kind of makes sense, but also note that % positive rate in the far right column. Averages and Medians, while informative, give you little projectability of ultimate outcomes. As the saying goes, never cross a river that’s on average 4 feet deep.
By now, most of you will be familiar with the models and their signals. If not, please study the guide I have published.
The full book of 250+ charts covers the whole asset spectrum from equities, bonds, commodities, FX, and Crypto to give you the most extensive view. On average, it will generally provide a good 5-10 set-ups on a weekly basis.
A reminder that you can now also use my models in TradingView scripts, which I made available for subscribers to use on their charts for a fee. If you are interested, ping me an email with your TV username. Note that only paying subscribers will be granted access. No exceptions.


