

Friday Chart Book
March 28, 2025

What’s going on? US stocks have tried a bounce and failed at the 20 ema line (subscribers were told of this possible fail in the Mid-Week Update), while US 30-year Treasury yields are back close to levels where equities broke down in February. I am writing this on Thursday close.

Meanwhile, US yield curves are continuing their steepening trend, with 5-30s now breaking September highs (when overall yield levels were 80 bps lower). A quick Fibonacci retracement chart would suggest that we now have another 20 bps to steepen as the next target.

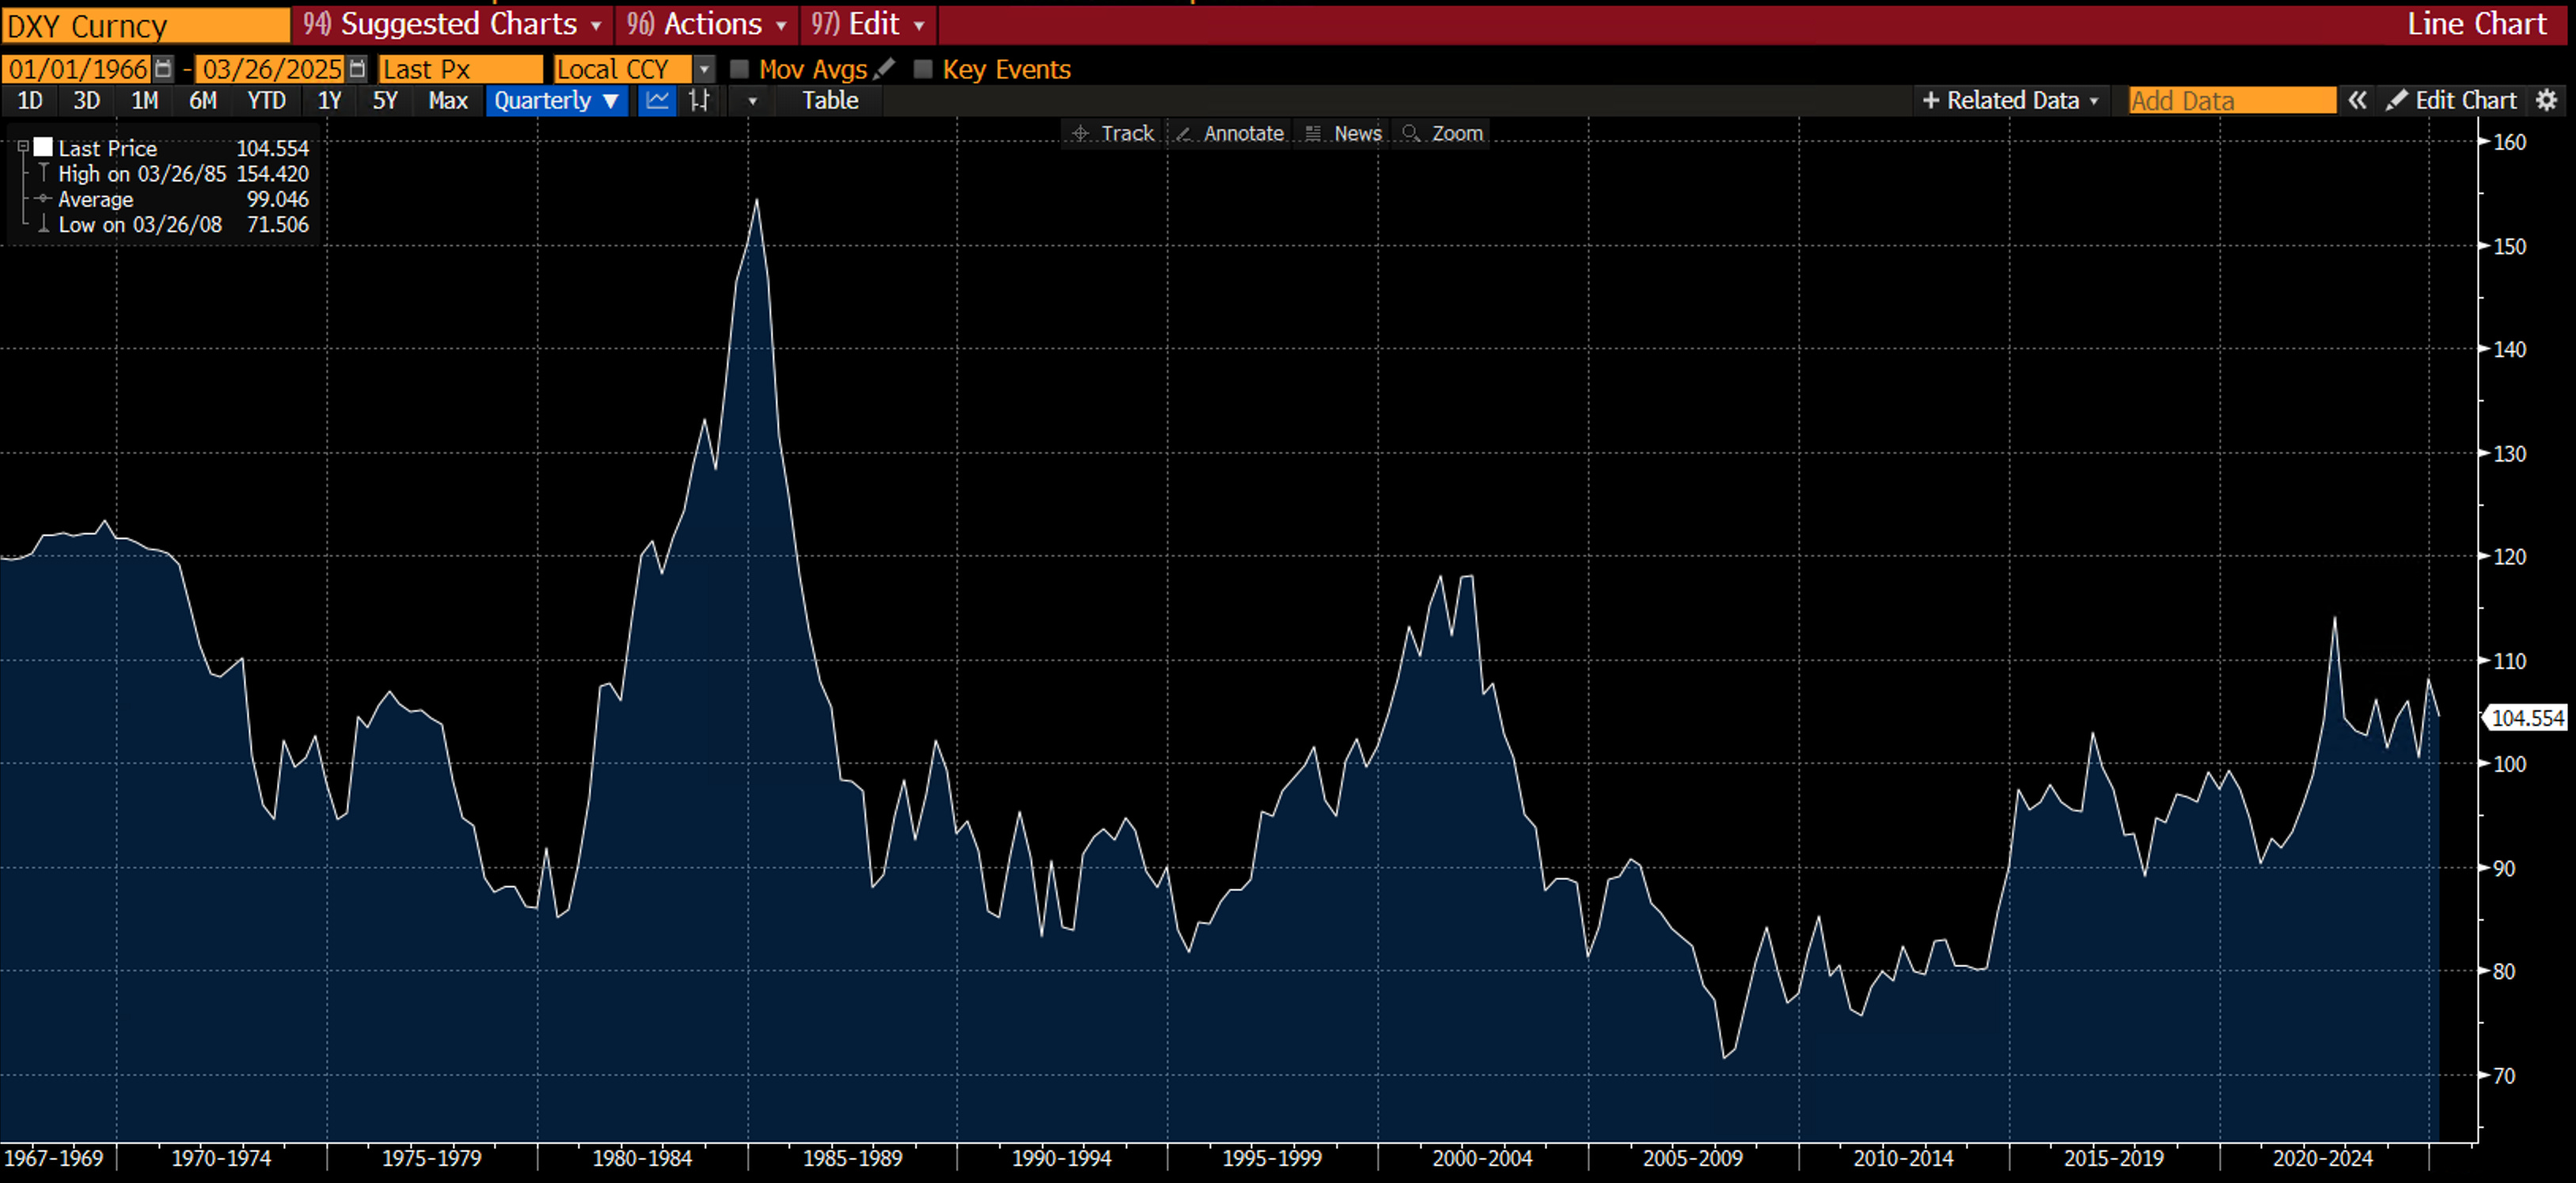
The long-term chart of DXY is still showing a topping process but would suggest there is plenty of room for it to fall.
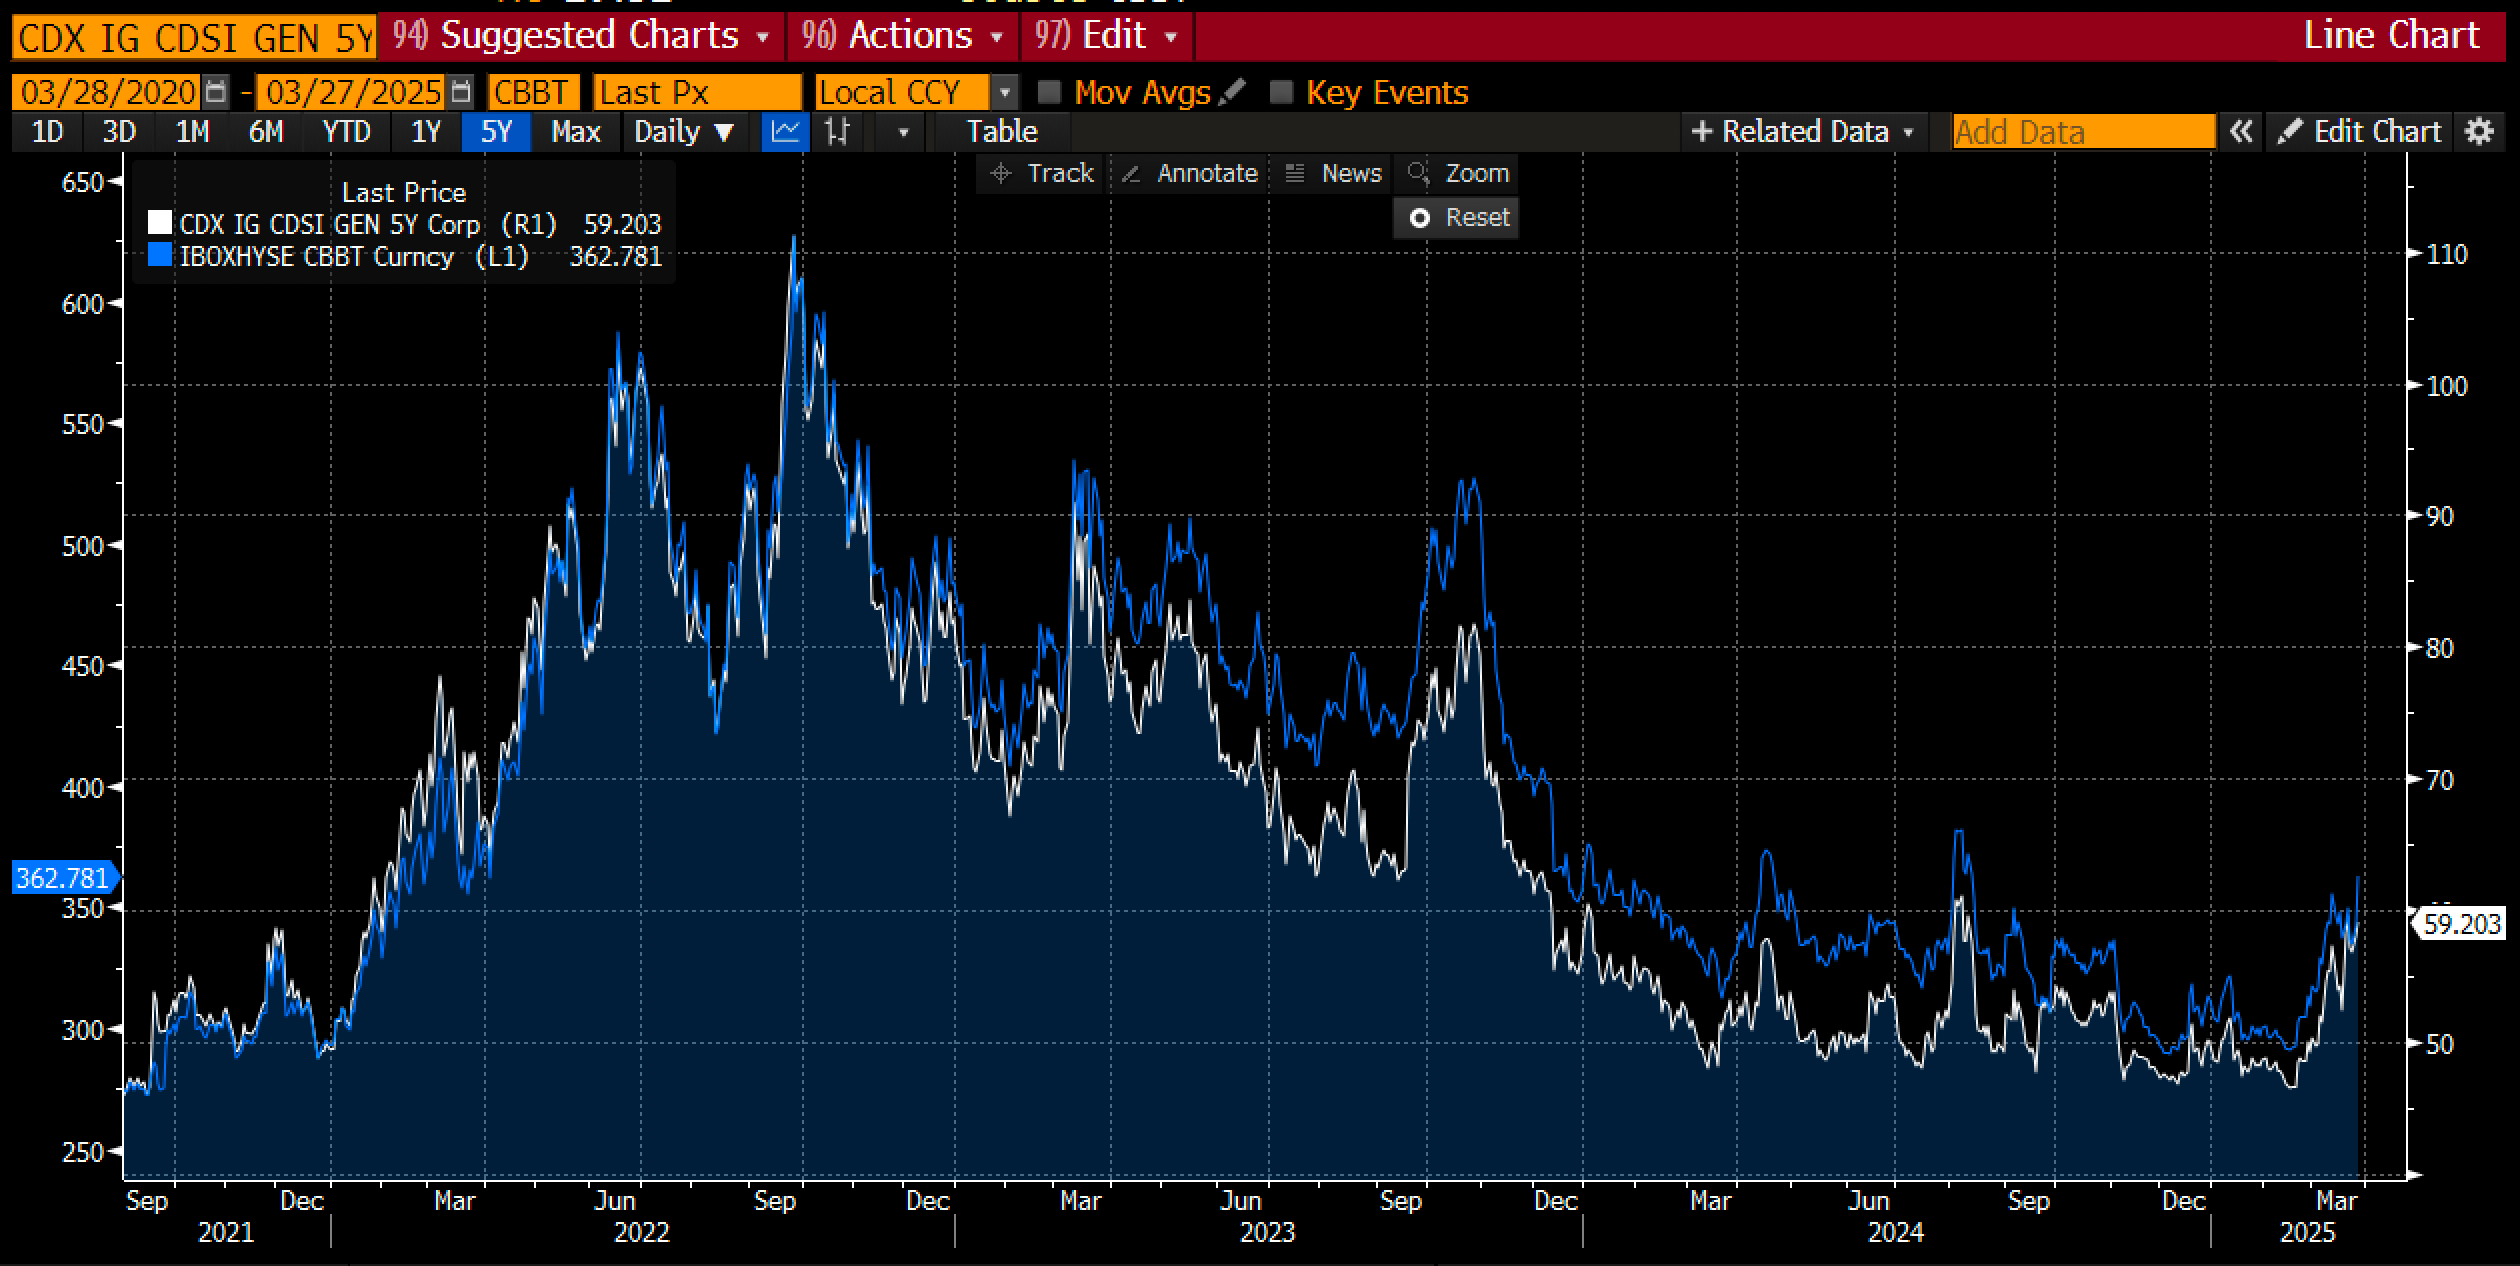
US Corporate spreads (CDX IG / HY) are widening and seeing levels last seen during the JPY carry unwind in August of last year.
The probability of the Fed holding rates until the end of the year (SFRZ5) is around 30%, which puts a firm floor on how much yields can rally in the current macro context.

How do we tie this all together? I will go into more detail further below the paywall, where I give my view of the world.
Paper Alfa’s buy-and-hold portfolio for 2025 is resilient in the current environment, showing still a more than 8% return YTD.

Our 3 tactical models have been on fire and guiding us in break-out and reversal setups. Here’s an example on AAPL, where we had two reversal buy signals close to the lows around 210 (green triangles), which worked nicely as a signal for a bounce. The momentum signal (purple marker), meanwhile, highlighted to us a short at around 235, which was very timely.

You can now also use my models in TradingView scripts, which I made available for subscribers to use on their charts. This is not for free and incurs an additional cost.
If you are interested, ping me an email with your TV username. Note that only paying subscribers will be granted access. No exceptions.
The 7-day trial window is still open; why not subscribe?
Let’s now go into more detail and read what Macro D has in store for us. We then scan the multitude of charts I have updated below. 250+ charts, plenty to scan through.
Let’s go!
