

Friday Chart Book
ATH, Rate Cuts and Tariff Deadlines

I hope you all had a successful week. It's hard to imagine anyone is unhappy with several markets printing all-time highs and BTC breaking out to new territory.

What happens after all-time highs in the SPX? I have run a little script in Python, which gives me the following results. The red dots are new all-time highs, while the table summarises the median and mean forward return.


Optically, it seems a new all-time high in the past 25 years has yielded new all-time highs. Forward returns over the following week, month and quarter tend to skew positively. The outliers can be found in 2000 and then again in 2007; we all know what followed. Structurally, it looks very similar to the COVID bounce, which then produced a row of new highs in the following months. Conditions, however, were markedly different back then as both monetary and fiscal floodgates were wide open.
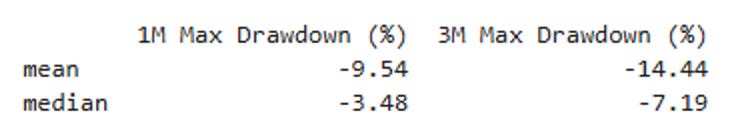
Bitcoin’s analysis looks even better, although new all-time highs over the past 3 years have also seen large subsequent drawdowns.


While average/median returns look good following ATH, it’s also important to highlight that some large drawdowns have also occurred over 1 and 3-month horizons.
The most uncomfortable question these days is why, with financial conditions so easy, are we still talking about the necessity for the Fed to deliver cuts? I’m sure the White House staff has excellent answers for this. Much of the expectations in the front-end (1y1y OIS vs SOFR below) are due to the intense pressure Powell and his committee are experiencing from Trump to cut rates by way more than “only” 1% currently priced. This pressure won’t go away, and I’m expecting the heat to be turned up by the announcement of who is going to take over the Fed next year. I don’t think Trump will stop there, a shadow council or even replacing people on the board is going to be on the cards. Things can get nasty, which bond markets won’t like. I’m expecting curves to steepen drastically under those scenarios.

Meanwhile, we are still very much in the dark as to what effect the announced tariffs will have on growth, inflation and corporate profits. I was thinking about this a lot, and I will write a separate post on it. The 4 trillion USD of imported goods (13% of GDP) will likely see an average of 15-20% of tariffs levied. Hard to say what the overall number is, but let’s assume it’s around 500 billion USD of a “tax” that someone will have to pay.
I assume that consumers will likely face the costs, but given high profit margins, US importers might choose to swallow some of the costs. Impossible to say. Exporters, meanwhile, are already facing pressure with a declining USD, making it less attractive to drop prices on their end. Letters have been sent, and “deals” are being done as we speak. We will get more clarity over the coming weeks and months. To me, the risks of no concrete deals being struck with those who matter (EU, Japan and China) are currently mispriced. Why would any nation sign a legal deal that would bind them to trade policies well beyond Trump’s term? I don’t think anyone would go for this, so some escalation and retaliation probabilities are underpriced by markets.
The 2025 buy-and-hold portfolio is still tracking around +14% YTD in USD, comfortably beating the standard indices.

A reminder that you can now also use my models in TradingView scripts, which I made available for subscribers to use on their charts. This is not for free and incurs an additional cost.
If you are interested, ping me an email with your TV username. Note that only paying subscribers will be granted access. No exceptions.
If you are interested in exploring Paper Alfa’s full package, subscribe below.
Let’s now read some of Macro D’s latest thoughts on tariffs and central banks, before we go through all 250+ chart setups across Rates, FX, Commodities, Crypto, Stocks, and ETFs.
Enjoy a fantastic weekend!
