Friday Chart Book
August 16, 2024
The speed and ferocity of the risk rebound is quite astonishing. I don’t remember any episode in the past when we went from a recession regime to reflation in a matter of a week. These are exciting times, and it’s easy to lose one’s focus in the middle of this. While I still don’t think this episode is over, I took profit on the short equity trade during the week just as we were breaking above the 50-day average ahead of retail sales. It would have been too frustrating to be on the right side of the equity sell-off without anything to show for it.
What has changed? Clearly, bond longs jumped into another wave of buying post-CPI, cementing the Fed cut plus some tail risks. This was then quickly unwound on Thursday post retail sales, which showed a solid consumer demand picture. Questions followed. What if there is more fluke than substance in recent data weakness? Are we facing a rebound? The much-observed Atlanta Fed tracker interestingly ticked down a bit post the round of numbers but is still showing a healthy expansion.
Is everything forgotten? I never really believed that markets bear a memory in the similarity we humans do, but those massive gyrations normally leave marks on humans, which then, in the aggregate, impact markets. The JPY was the main culprit for the massive carry unwind. Interestingly, the JPY bounced back up weaker but was in a particularly tight range for a few days until things started moving again yesterday.
For the doomers out there, here is a chart that overlays the USD/JPY rate with the 1996-2000 period and today. I don’t like analogs, because I think they always fail. But they give you good reference points as to what is possible.
The VIX, which in spot (untradeable) pinged the 60 mark (futures traded 30), is now closing in on 15. Looking at the futures below, you can see that the October expiry (expiring before the election) is trading at a slight premium, given the anticipated election volatility. I think the market has retraced this too fast too far. I, of course, have no idea where we are going to trade, but at these levels, if you think this is just a technical bounce, hedges look ok value again.
One interesting point I keep pondering is the following chart which shows the FF rate (blue), 30-year JGB’s (white), and US 10-year Treasury yields (purple). If you really believe that there is a massive downturn coming, 30-year JGBs will have a long way to go. Alternatively, their reluctance to follow in the aftermath of this month’s developments could be interpreted that things aren’t as bad as feared. Certainly something to keep your eyes on.
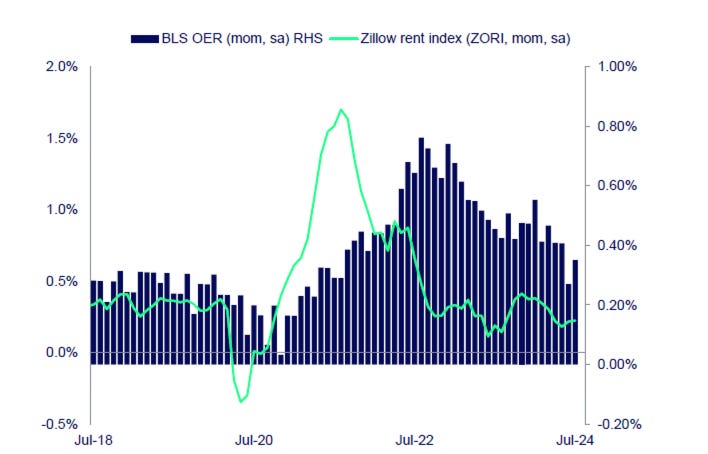
As for inflation, it’s important to look at the recent track lower of OER in the basket following the Zillow rent index. It’s interesting that the latter has now stopped falling and is even picking up. This would, all things being equal, point to less disinflationary forces coming through the housing component.
All in all, I’m vigilant with all new things coming in and respect the market’s violent risk comeback. You always learn something new. I’m still holding on to my bond longs and looking for cheap option hedges now volatility has subdued. It’s not about being right about things but making money and taking risks where there are great opportunities. While the story of the first half of the year was one of expansion and upcoming monetary easing, the market is still somewhat in flux as to what we shall call the story of the second half. Don’t get carried away. Stay nimble, always.
By now, most of you will be familiar with the models and their signals. If not, please study the guide I have published.
The full book of 250+ charts covers the whole asset spectrum from equities, bonds, commodities, FX, and Crypto to give you the most extensive view. On average, it will generally provide a good 5-10 set-ups on a weekly basis.
A reminder that you can now also use my models in TradingView scripts, which I made available for subscribers to use on their charts for a fee. If you are interested, ping me an email with your TV username. Note that only paying subscribers will be granted access. No exceptions.
Let’s also read my friend Macro D’s recent thoughts on markets before engaging our scanning eyes across the multitude of charts that I have updated for you below.


