Friday Chart Book
August 23, 2024
The long-awaited Jackson Hole day is upon us. As of writing this, we still have a few hours until Powell serenades us with his long-awaited speech. I don’t have any strong views other than that he will hold the line with what has already been set. As a policymaker, I would like to be firm in my view, but I also like to keep my options open. That’s natural behaviour. It was interesting that other FOMC members took the stage yesterday, sending their views, which pretty much all sounded like there is no rush to cut rates and that a gradual and methodological approach is warranted. Nobody should be surprised, and that makes sense. Bond markets, however, didn’t like that at all and promptly sold off in line with equities who, after a great stretch, also seemingly didn’t like a less accommodative stance.
Here is the full schedule for the event. I would also keep an eye out for more academic discussions surrounding the effectiveness of policy transmission. Remember, it’s not the answers they give us but the questions they ask themselves which should give us a hint as to what they are thinking about. I will share my thoughts after Powell’s speech in the paid section further below.
The models are currently long bonds and have been since June and are now again long stocks and short the USD. There were a few reversals flashing like in Gold, which was a great setup during the week while. Read further below to explore the 250+ charts ready to be investigated.
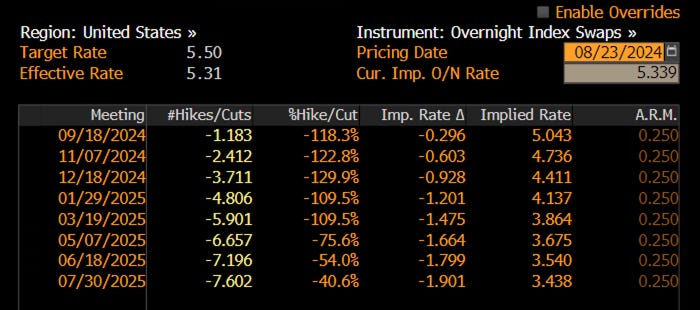
For now, we are still sitting with 93 bps of cuts for the upcoming 3 meetings and nearly 200 bps of cuts into next year. That’s a lot of juice in there. The path, of course, is totally achievable but will require a slowdown showing up pretty damn soon. If July’s NFP was a fluke, then those prices would have to adjust to be higher. Regardless of what Jay says, we will still have a lot of cuts priced for the coming two weeks until the NFP lottery hits us with a binary event. My best guess is that we won’t see a low number, thus cementing the 25 bps cut with the cumulative pricing of cuts for December coming down to about 80 bps. On a weak number, we will probably go back to 100 bps or more, so it’s pretty even. Pick, and pick wisely.
The interesting part is still how much the perceived cutting cycle is deemed to happen pretty much exclusively over the next 15 months, while 2026 and out are pretty much flat. This doesn’t appear to be gradual at all but rather a swift adjustment. As usual, markets will be wrong, and I will opine in another post on the odds and perspectives given alternative scenarios.
Referencing the pricing above with the current GDP tracking, which is still around the 2-3% mark in real terms, would be the question: what has actually changed?
The swings between the inflation to now the growth focus with downside fears will possibly be the dominant force in the coming months. As always, we will most likely not see any immediate conclusion, which will give plenty of opportunities as volatility rises.
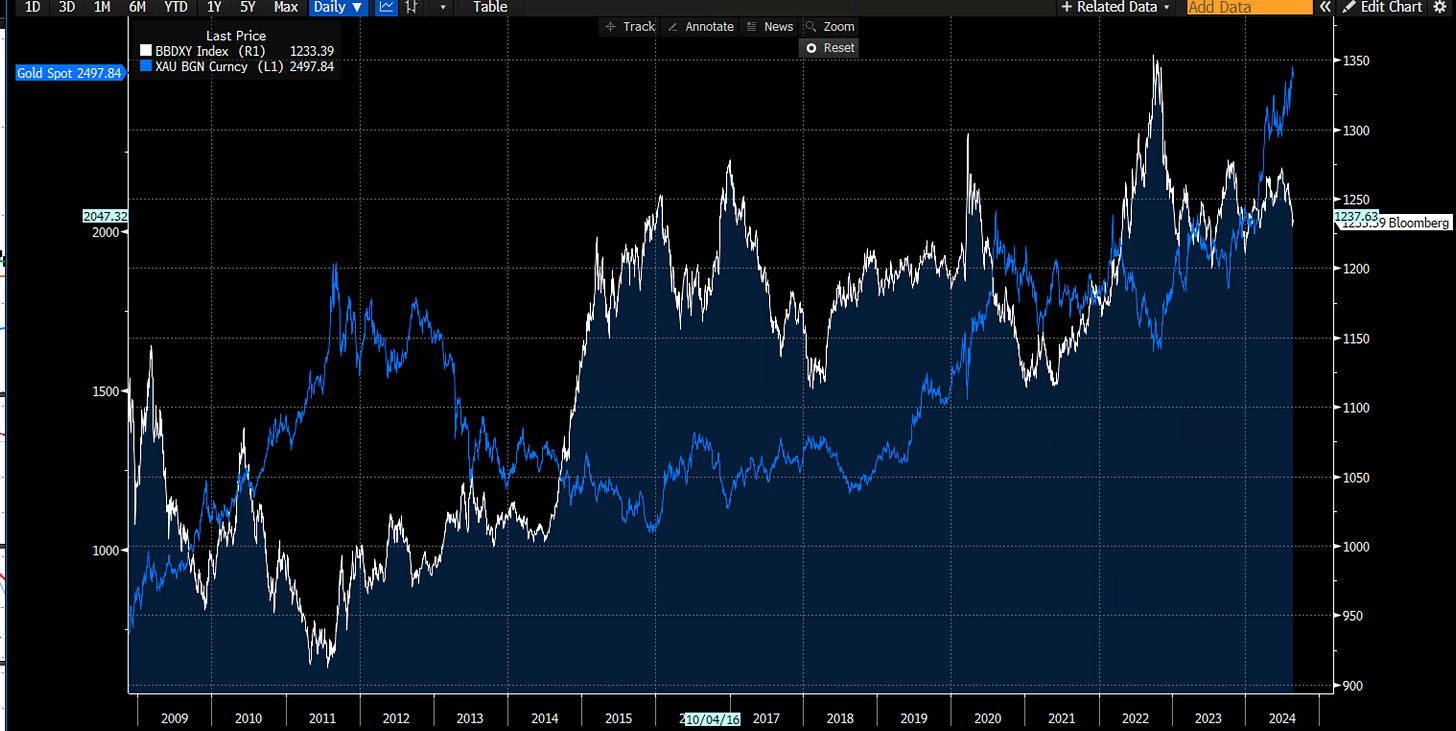
The US Dollar has been seeing a bashing in the past few weeks, now aiming to see the lows of last December. This also corresponded with a break higher in the Gold price to all-time highs, which is also quite telling. The white line is the equal-weighted Dollar basket.
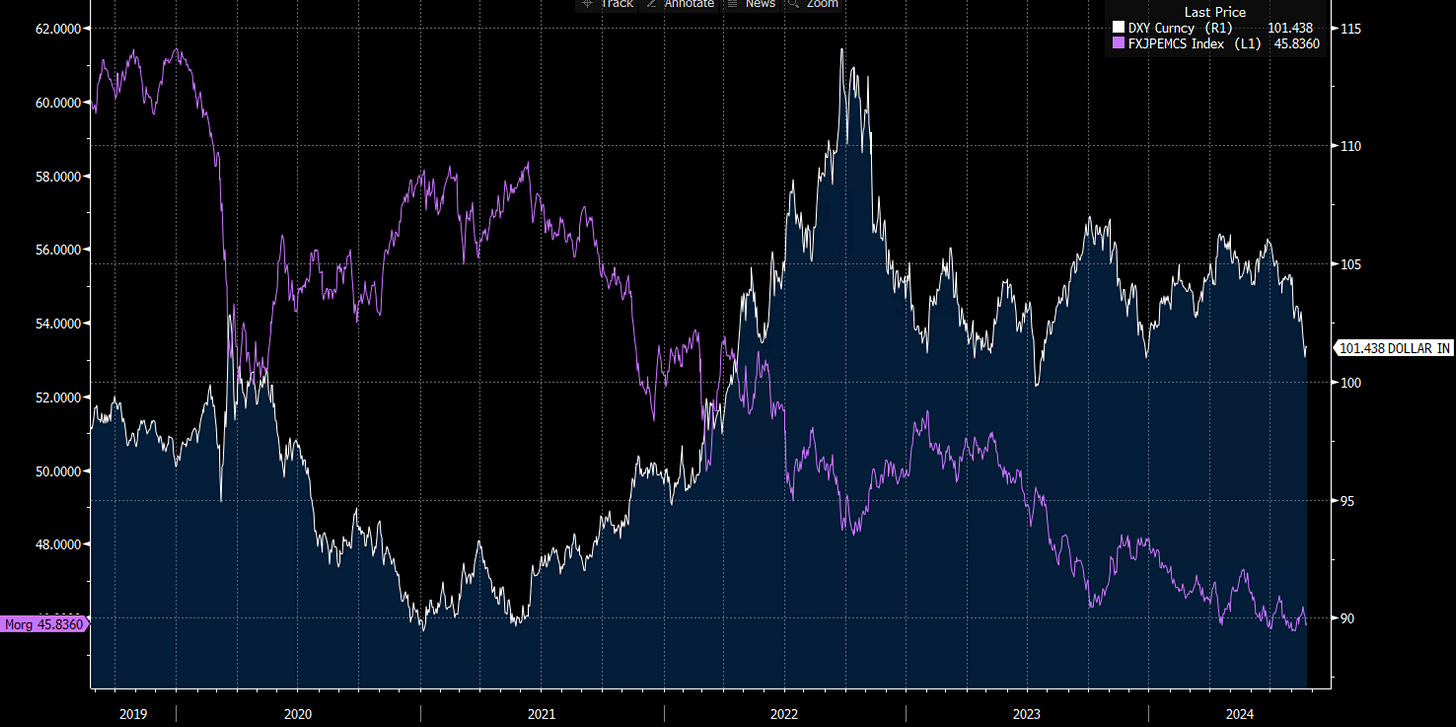
This somewhat hides the fact that EM FX (purple line) is under much pressure compared to their developed market counterparts (DXY Index white).
As such, the increased bond volatility makes sense (red line), while both FX and Equity Volatility still seem subdued on an index level.
I think it’s a good time to expect higher volatility in the months ahead. Don’t forget that there is an election coming, which seemingly nobody is now interested in, but facts don’t change. It appears to me that both Harris and Trump have rather ambitious expansionary goals, with dubious methods to increase taxes. September also has rather seasonal volatility, and I sense this year won’t be an exception. Stay the course and remain nimble. Anything can happen. Keep an open mind and keep your strong opinions loosely held.
Meanwhile, Ueda confirmed his hawkish stance on Friday, confirming that the BoJ still anticipates raising rates. Those who have followed the writings on here by Macro D know that he pretty much nailed the long since July and he continues to be bullish. Why? A chart that speaks a thousand words below.
By now, most of you will be familiar with the models and their signals. If not, please study the guide I have published.
The full book of 250+ charts covers the whole asset spectrum from equities, bonds, commodities, FX, and Crypto to give you the most extensive view. On average, it will generally provide a good 5-10 set-ups on a weekly basis.
A reminder that you can now also use my models in TradingView scripts, which I made available for subscribers to use on their charts for a fee. If you are interested, ping me an email with your TV username. Note that only paying subscribers will be granted access. No exceptions.
Let’s also read my friend Macro D’s recent thoughts on markets before engaging our scanning eyes across the multitude of charts that I have updated for you below.


