Friday Chart Book
April 5, 2024
Bonds have confirmed the increased inflation premium narrative over the past week. Atlanta Fed President Bostic's hawkish comments fueled this, which shouldn't come as a surprise as he is known to be a hawk.
"Productivity is elevated. You can get growth and see inflation come down. But it will come down much slower than people expected. We need to be more patient than many have expected"
The bond sell-off slightly reversed after a soft ISM services report, which showed that the key employment subcomponent measure stayed weak (51.4 vs a 52.8 consensus).
The chart below shows the steepening bias of the US spot and forward curve movement over the past week, with an average 15 bps sell-off.
The weaker ISM also caused a reversal lower in the USD while lifting equities and supporting already bullish commodity price action.
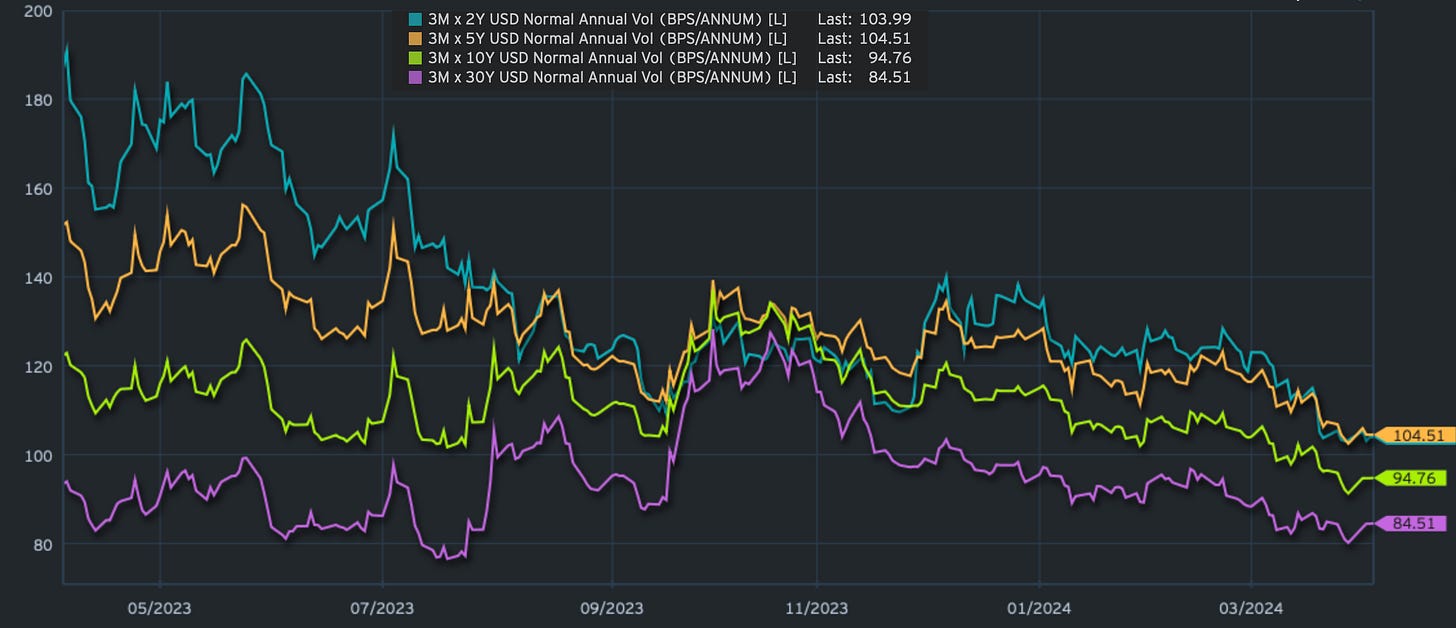
The backup in yields, however, didn’t change implied vols much for now, as the following chart shows, where we are plotting 3-month expiry implied annual volatility for 2,5,10 and 30-year tenors.
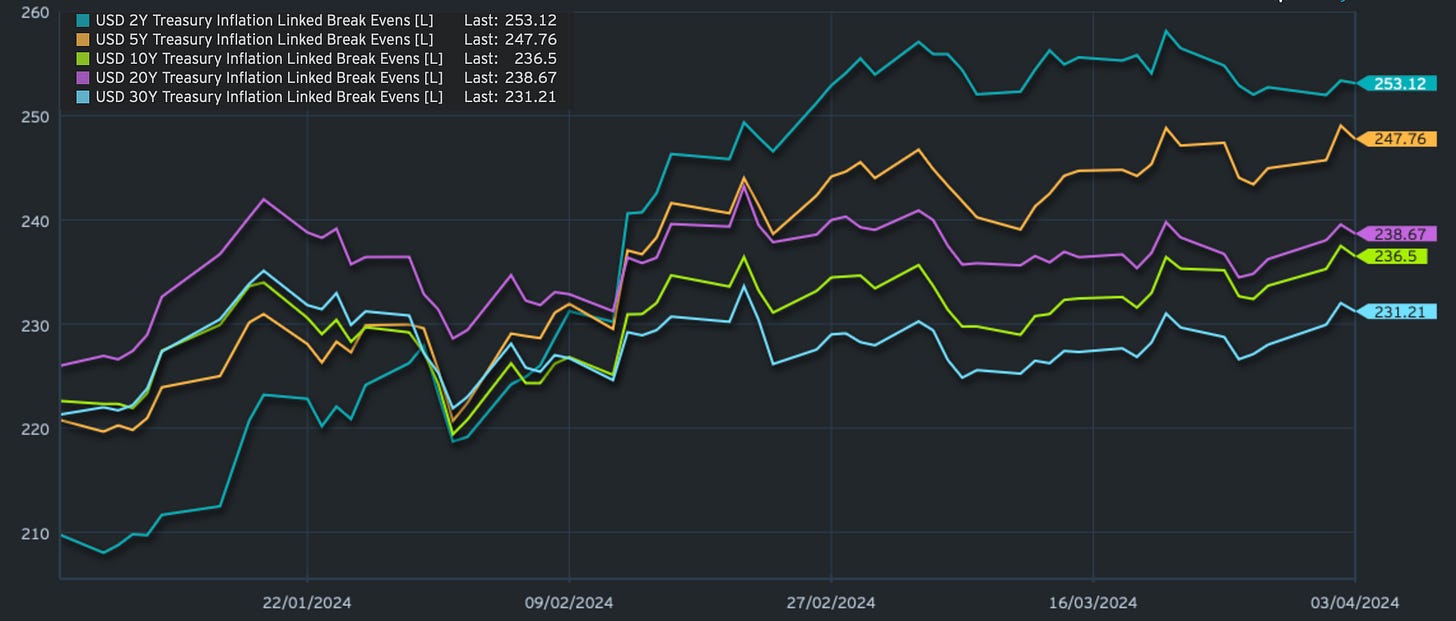
Increased inflation-risk premiums are also lifting break-even inflation rates, where we have seen an uptick over the past 3 months, especially in 2 and 5-year maturities (TIPS breakevens below).
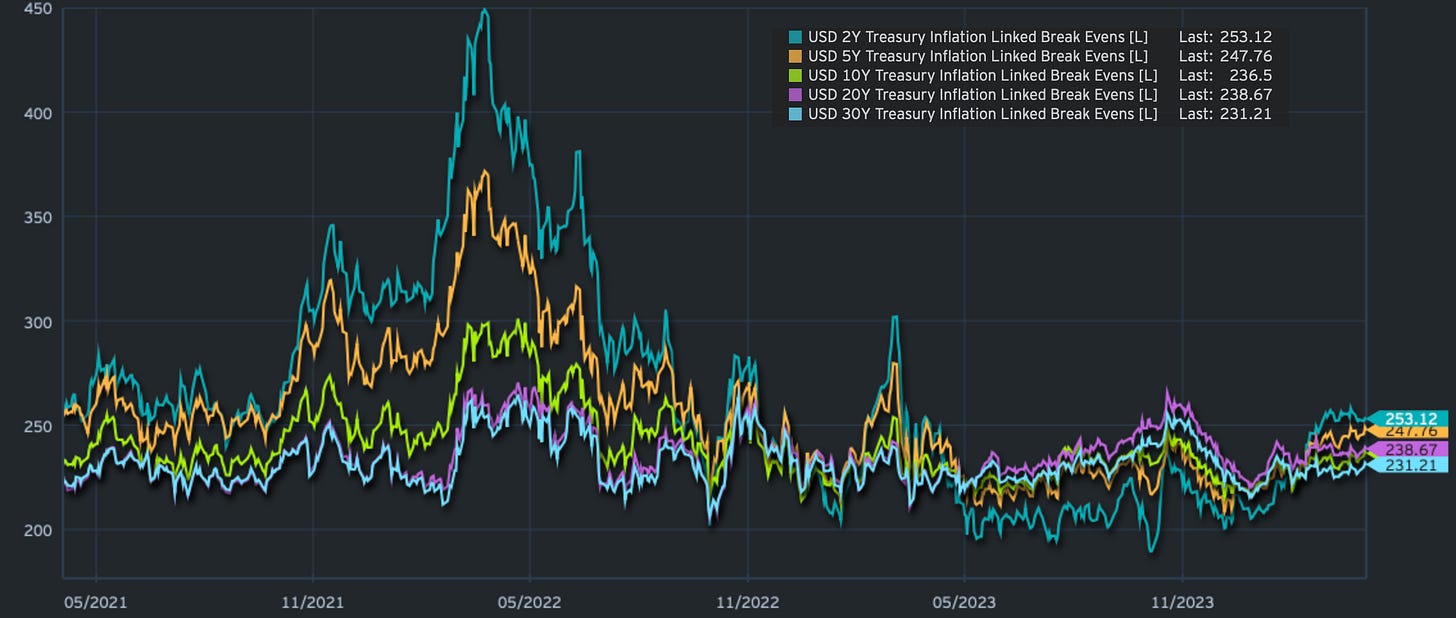
Over a longer history, however, inflation expectations have been relatively contained.
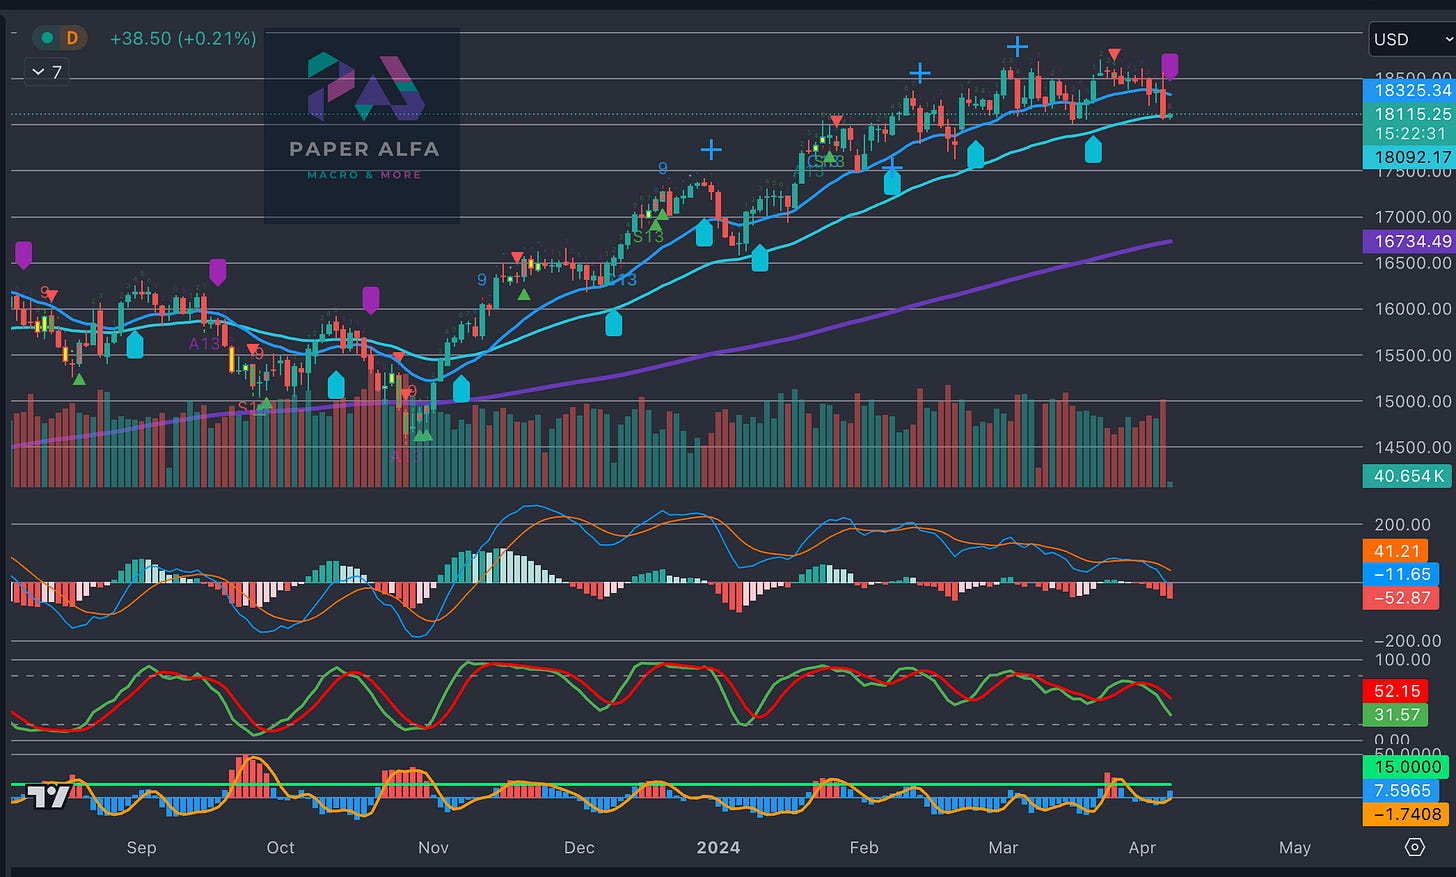
Thursday’s swift turnaround in equity markets came as a stark reminder that risks are never zero. A nasty key day reversal (higher daily high followed by a lower daily close) sent emotional shockwaves across the fintwit universe. The reasons for the reversal were found in geopolitical and monetary corners, although I would be careful with jumping to any quick conclusions. Believe it or not but markets can reverse without a catalyst. In addition, US tax season will weaken overall liquidity conditions throughout the month, so that should also be considered.
Overnight price action is giving us some stabilisation with payroll looming on today’s horizon. We have a lot to play for. Stocks look a bit vulnerable here thought with the momentum model indicating a short trade on NQ, which should be confirmed on the close as we are sitting bang on the 50 ema support. This will be interesting to watch.
Let’s now focus on the charts. By now, most of you will be familiar with the models and their signals. If not, please study the guide I have published. I have now also recorded a brief video tutorial, which you will find further below.
The full book of 254 charts covers the whole asset spectrum from equities, bonds, commodities, FX and Crypto to give you the most extensive view. It will generally provide a good 5-10 set-ups on a weekly basis.
Let’s go!


