

Friday Chart Book
March 8, 2025

I am now back in the saddle from a week off and have finally had some time to write. While I have some thoughts as to the developments during the week, I think it is good to let the charts below speak first before dissecting some very market-moving events. You don’t need an overpaid economist telling you about the positive impulse the announced German fiscal package might have on growth. Just look at the chart of the EUR and German bond yields in the paid section below.
This is just another marker on the road for my regime shift hypothesis. It’s all happening rather fast in front of our eyes.
I will share more thoughts in tomorrow’s Attack the Week (ATW) publication. For now, I shall leave you with the deep thoughts of our own Macro D, who reflects on one of the most important macro weeks seen in a while.
These markets are going to be volatile and offer plenty of opportunities. It is, therefore, very timely that I have launched the intra-day model this week. All current subscribers should now have access. If you are interested, read below.
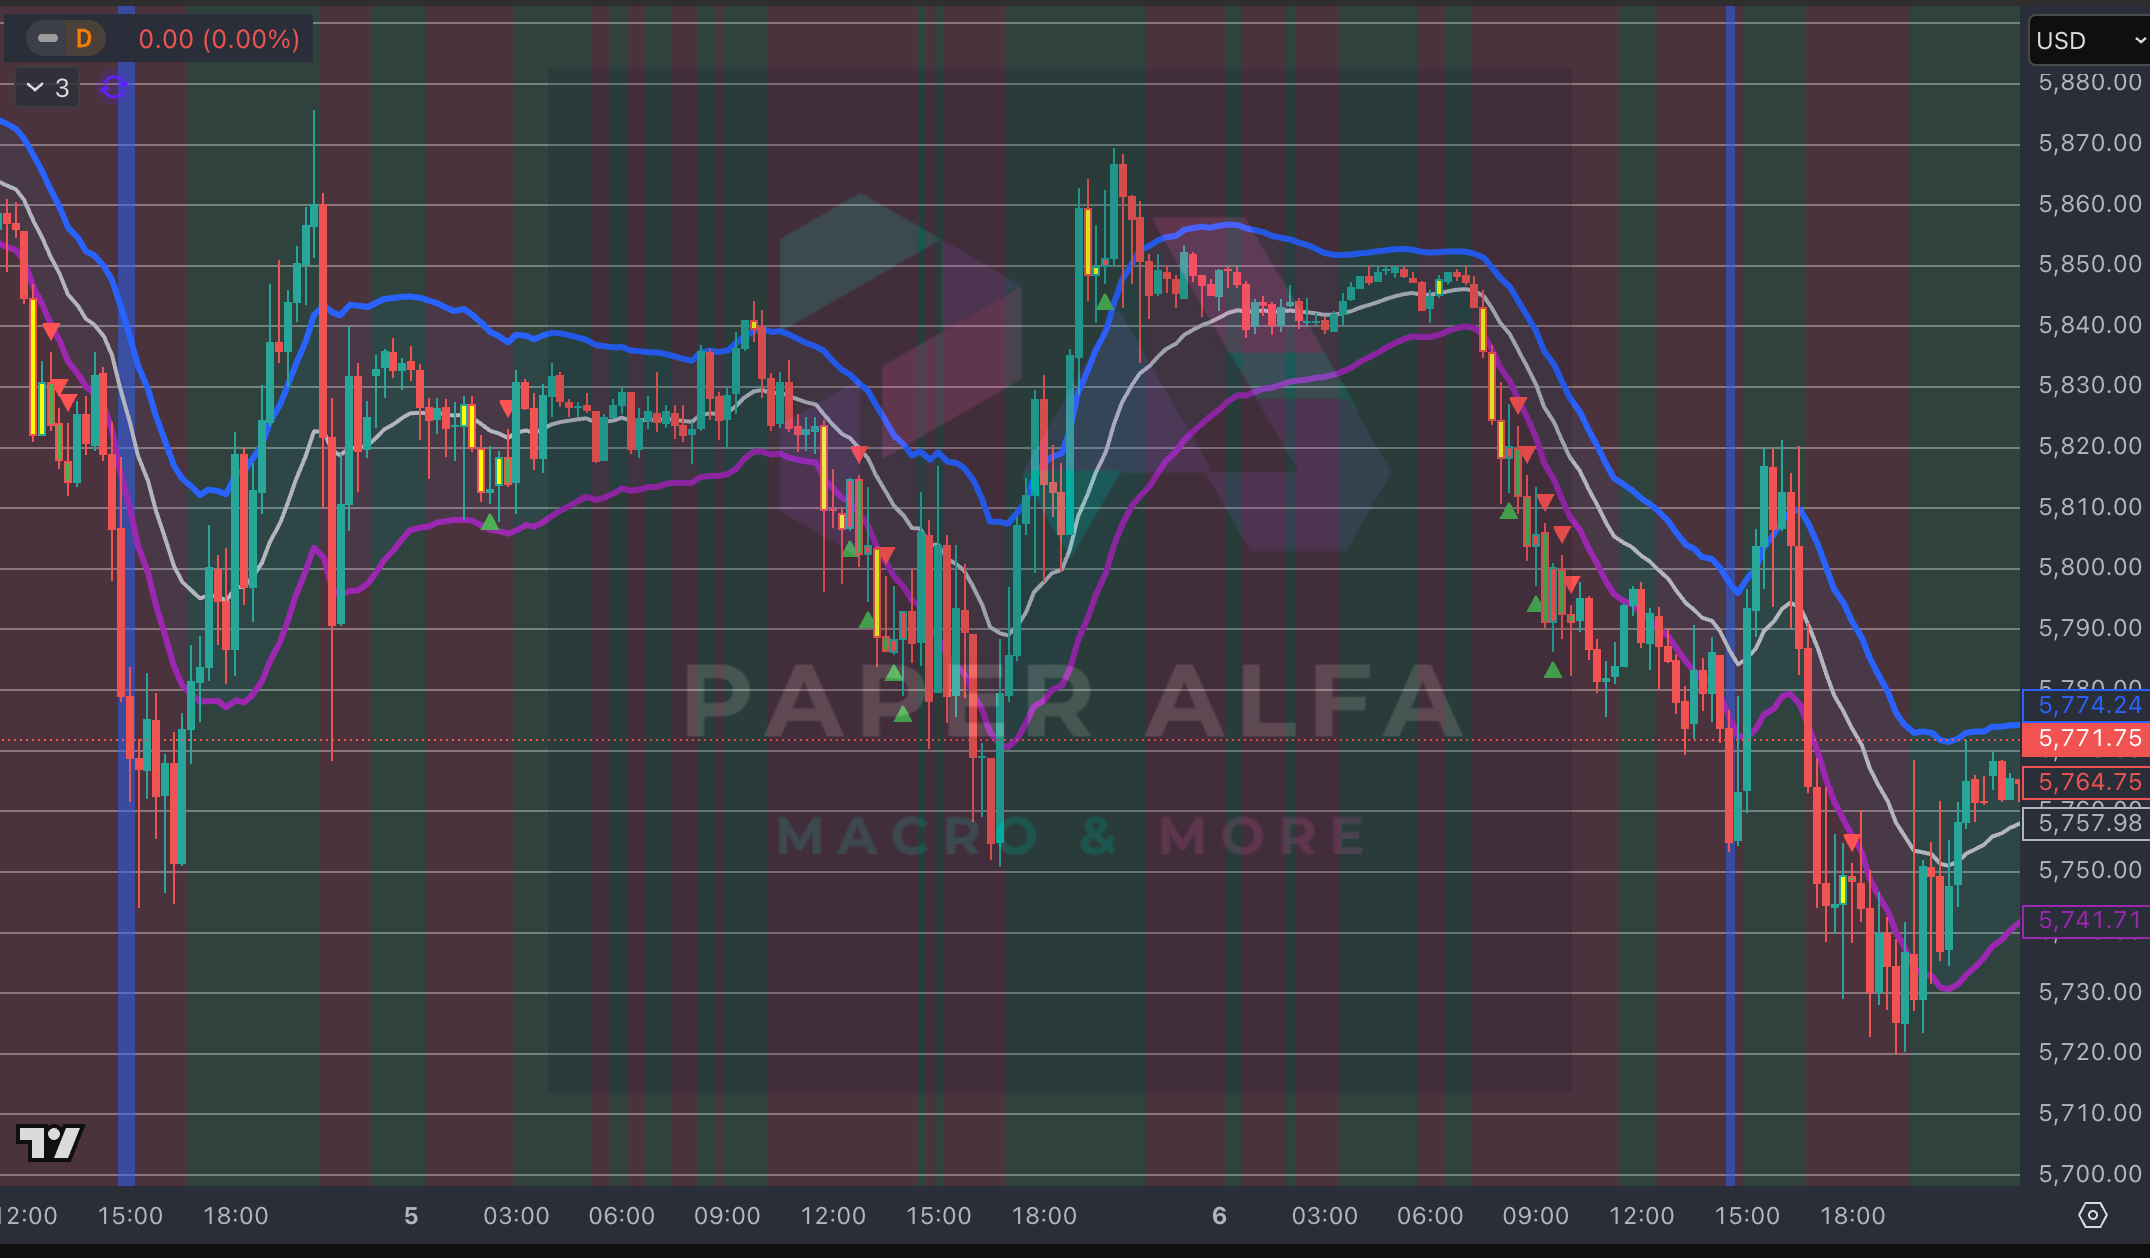
Here is a little example of how the intra-day model saw setups in the ES during the past volatile week. The two vertical purple lines indicated an extreme intra-day oversold condition, which opened up a short-term buy opportunity. The green background indicates a “buy-zone” environment.
This is a reminder that you can now also use my models in TradingView scripts, which I made available for subscribers to use on their charts. This is not for free and incurs an additional cost.
If you are interested, ping me an email with your TV username. Note that only paying subscribers will be granted access. No exceptions.
Let’s now go into more detail and read what my friend Macro D has in store for us. We then scan the multitude of charts I have updated below. 250+ charts, to be more precise.
Let’s go.
