Friday Chart Book
April 18, 2025
We finally made it to the Easter weekend. A solid few days of rest and reflection are finally here. I don’t know about you, but the last few weeks have been rather thrilling but equally exhausting. As Lenin famously said, “There are decades where nothing happens; and there are weeks where decades happen.” It feels that way.
Blood is on the streets, and various relative value hedge fund strategies are suffering. We had large moves, shifts, and epic correlation breakdowns as of late. US Swap spreads, for example, imploded (swaps outperforming equivalent treasuries). What looks to be only a 15 bps move is a highly levered beast, where each basis point move equates to large US Dollar amounts.
We have also seen an equivalent volatility event in longer-dated Japanese government bonds and equivalent swaps. Below, the 30-year JGB vs OIS swap. No prices for guessing which way around people were positioned for.
While the dust settles and stories of pain and losses mount, let’s focus on the road ahead. Those familiar with my work would have fared well over the past few weeks. My macro roadmap and investment thesis were clearly laid out.
Let’s take stock of where things stand on each of the points raised.
The US Dollar continues to weaken
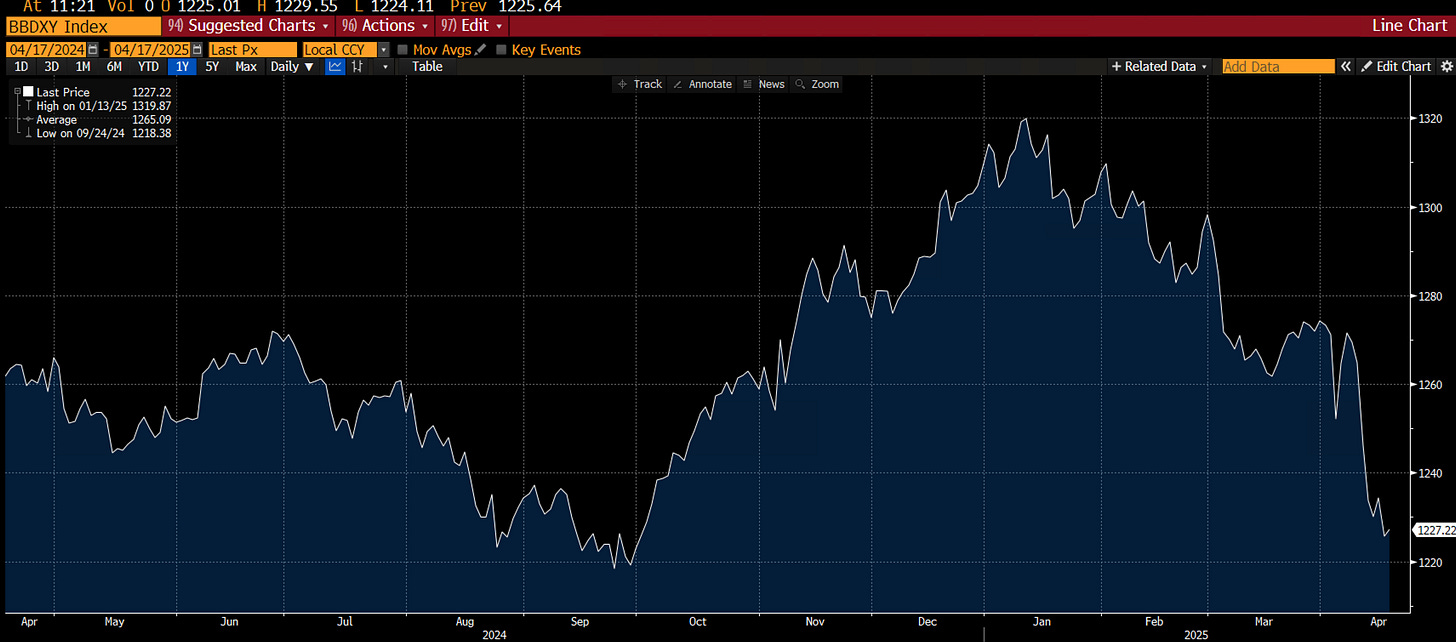
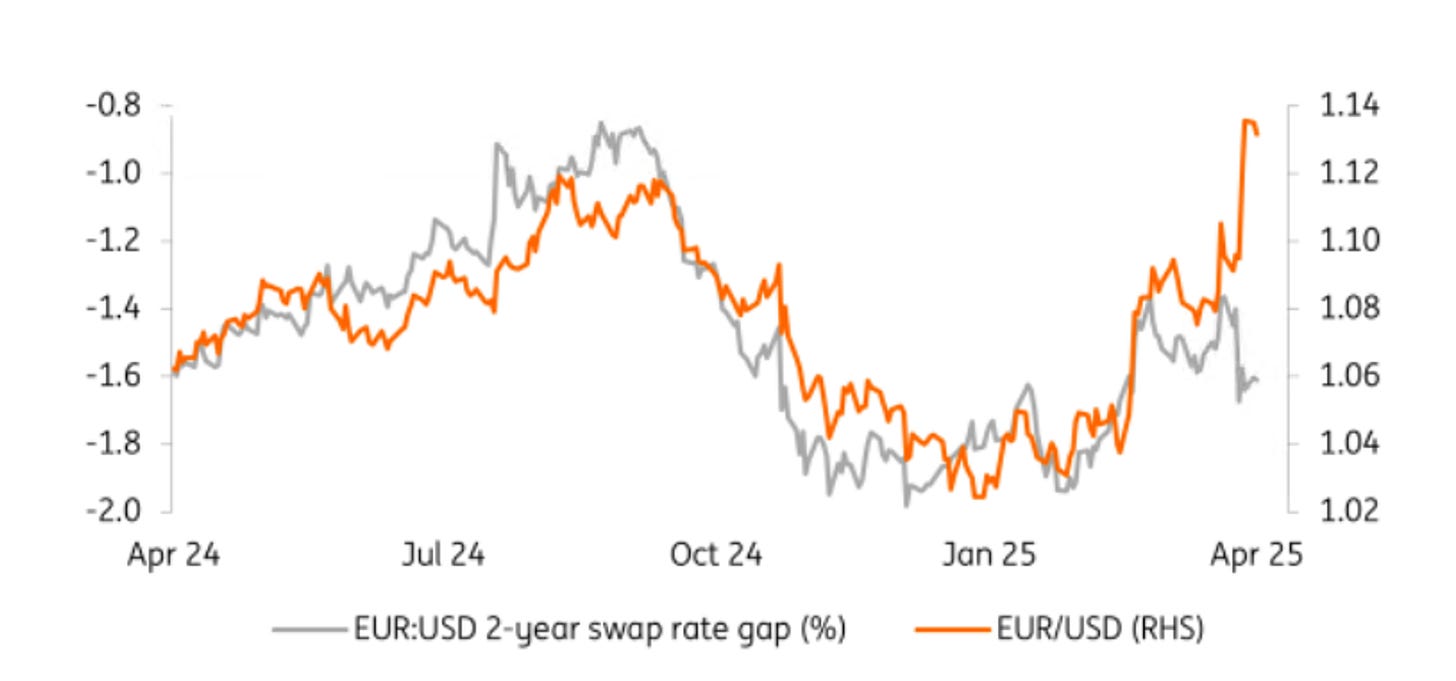
The US Dollar (above is an equally weighted index) has continued to weaken and is approaching September levels, which I think should see support, but will ultimately break lower. It’s also important to highlight that currencies (EURUSD below) have detached from their rate differentials in April so far, highlighting the speed of the US Dollar exodus.
US Stocks on an index level will likely re-rate lower
We have certainly seen a sharp rerating, with 5k proving to be the first support. I don’t think we are near a bottoming formation, but rather a whipsawing market where rallies will be sold.
Lower trade deficits and still elevated budget deficits mean steeper US yield curves
Yield curves have been remarkably stable in their relentless march steeper, and I expect this to continue.
Inflationary pressures might persist in the short-to-medium term. US Treasuries might not offer you the same diversification in a stagflationary environment unless we enter a recession
Treasuries have indeed surprised many, including me, as their diversification benefit worked in reverse. US 10-year treasury yields, as shown above, have barely moved in April. A stagflationary environment is not good news for bonds, as central banks will feel unable to ease aggressively. Powell’s comments on Wednesday clearly highlighted that there is no rush and that (ahem) they don’t entertain a put on equities. We shall see.
Real assets, like precious metals, should continue to do relatively well
Gold just saw a small blip in this whole deleveraging episode, while the more economically sensitive Silver saw larger drawdowns but then bounced back.
A special mention goes out to Bitcoin’s performance in this process, which held up remarkably well. Part of it might be the anticipation of more liquidity provision globally to support economies, while the other angle might indeed be the link to Gold and what constitutes reserve assets when US Treasuries fall.
With all eyes on inflation data, it’s interesting to read State Street’s latest PriceStats data and findings. Their latest high-frequency data for April shows a brief acceleration in inflation at the start of the month, largely driven by rising gas prices and strong seasonal trends in core goods like electronics and household equipment. While the strength in these categories is notable, especially household equipment, which is at a ten-year high, it has only brought overall inflation trends back to average levels. Sector-specific trends show mixed momentum, with inflation in headline, transport, and health categories lower than pre-tariff periods, while household equipment and apparel have seen increases, indicating only a modest tariff impact so far.
Meanwhile, broader economic indicators reflect a mixed picture. Media focus on recession risks has intensified. Labour market indicators, such as job postings, remain relatively stable, though high-frequency retail sales data show volatility, strong in early March but flattening later. GDP nowcasts for Q1 have been significantly downgraded, aligning with a softer growth outlook, although most hard data still remain above recession thresholds. Overall, the data suggests a slower-than-expected growth environment, accompanied by only moderately rising inflation pressures.
If those scenarios were to unfold, bond yields would reprice lower on the premise that the negative growth impact overshadows the short-term inflationary impulse, giving the Fed ample room to ease policy further.
What about equities? I don’t think a recession is priced as the main scenario. Over the past five downturns, the SPX fell on average 37%, starting with a P/E of 19 down to 12. We have seen a 13% fall so far with a running P/E of 19. Bloomberg runs a chart with historical P/E’s, which highlights the various “valuation” bands below.
Paper Alfa’s buy-and-hold portfolio for 2025 also felt the impact over the past few weeks but still managed to print a respectable YTD return of around 2.5%.
In addition to that, I’m updating the weekly allocation model on a regular basis, which has been going since 1977 and has only shown 3 down years. My momentum, reversal and intra-day models are keeping us up to date with meaningful break-out and reversal patterns across the global macro asset universe.
A reminder that you can join Paper Alfa’s full offering for a 20% discount until the end of April.
I wish those of you celebrating a glorious Easter weekend. May it be one of peace and serenity in these turbulent times. Let’s remember what really matters. I shall be back with ATW on Easter Monday.
Let’s now read some of Macro D’s latest thoughts before diving into the avalanche of 250 updated charts.


