Friday Chart Book
August 9, 2024
I truly hope you had a good week. If not, you are damn sure that you have learned a thing or two. After nailing the move last week and Monday, both my rates positioning and short risk exposure started giving back gains. I was prepared for that eventuality as the models were indicating overbought conditions in bonds and the equivalent oversold indication in equities. Still, I’m holding the same positions but significantly reduced.
As in any good play or film, the first act has been concluded. Huge volatility spikes are followed by more erratic, choppy conditions, which are noisy and bear little signal. This can be frustrating, but it doesn’t mean the story is changing. Systematic positioning might now be cleaner, but this may now morph into more widespread deleveraging. I’m watching yields for re-entry, but I am also considering the option of risk parity funds starting to sell their bonds to degross their overall exposure. So, things could get vicious. As in many things, deleveraging processes are particularly difficult to forecast. Be wary of overcrowded trades, regardless of how great they look.
The news about private credit balances shrinking caught my eye. Revolving consumer credit contracted -$1.7 billion in June (-1.5% at an annual rate). This is the second decline in the past three months. Apparently, this only happened 16% of the time in the past, with respect to a monthly net fall-off in credit card balances — and nearly half the time, the economy is in a recession, coming out of one, or heading into an official downturn.
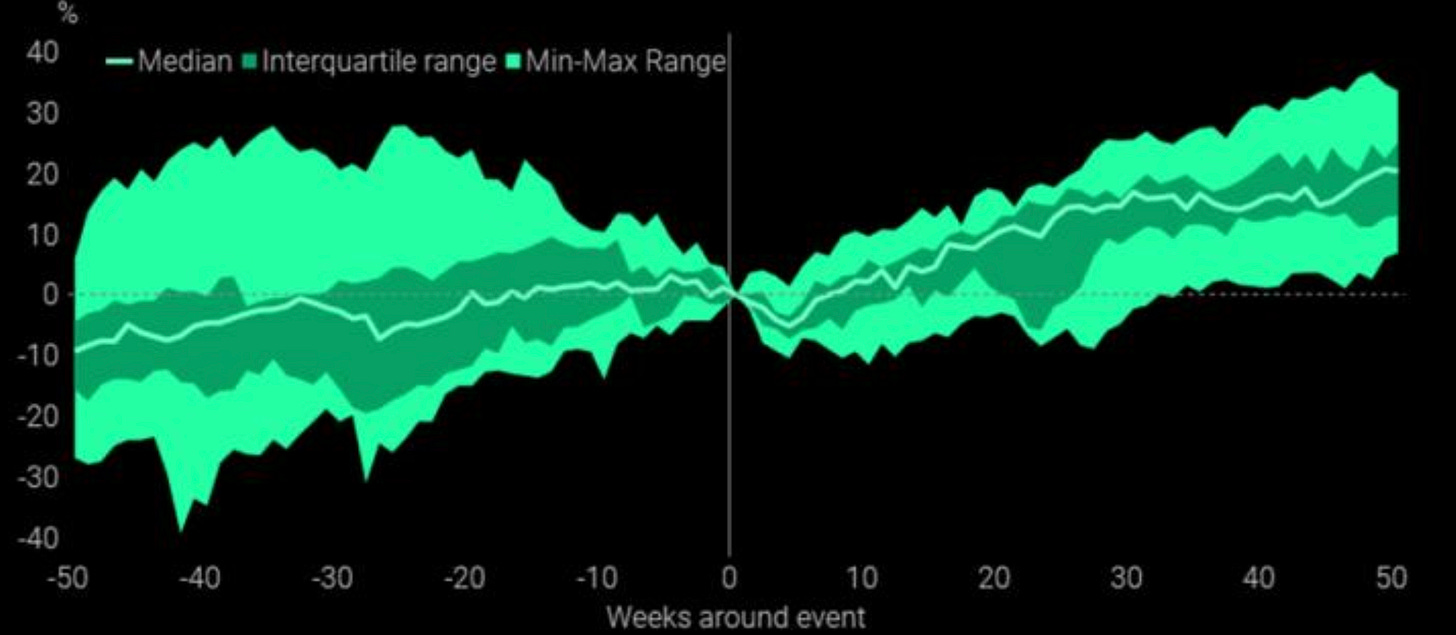
As for equities, some research would suggest that indices take 4-5 weeks before a sustained recovery begins. Markets tend to rebound on oversold conditions such as the current ones, but investors often sell into that strength, which can lead to a relapse. This happened, for example, in 2018,
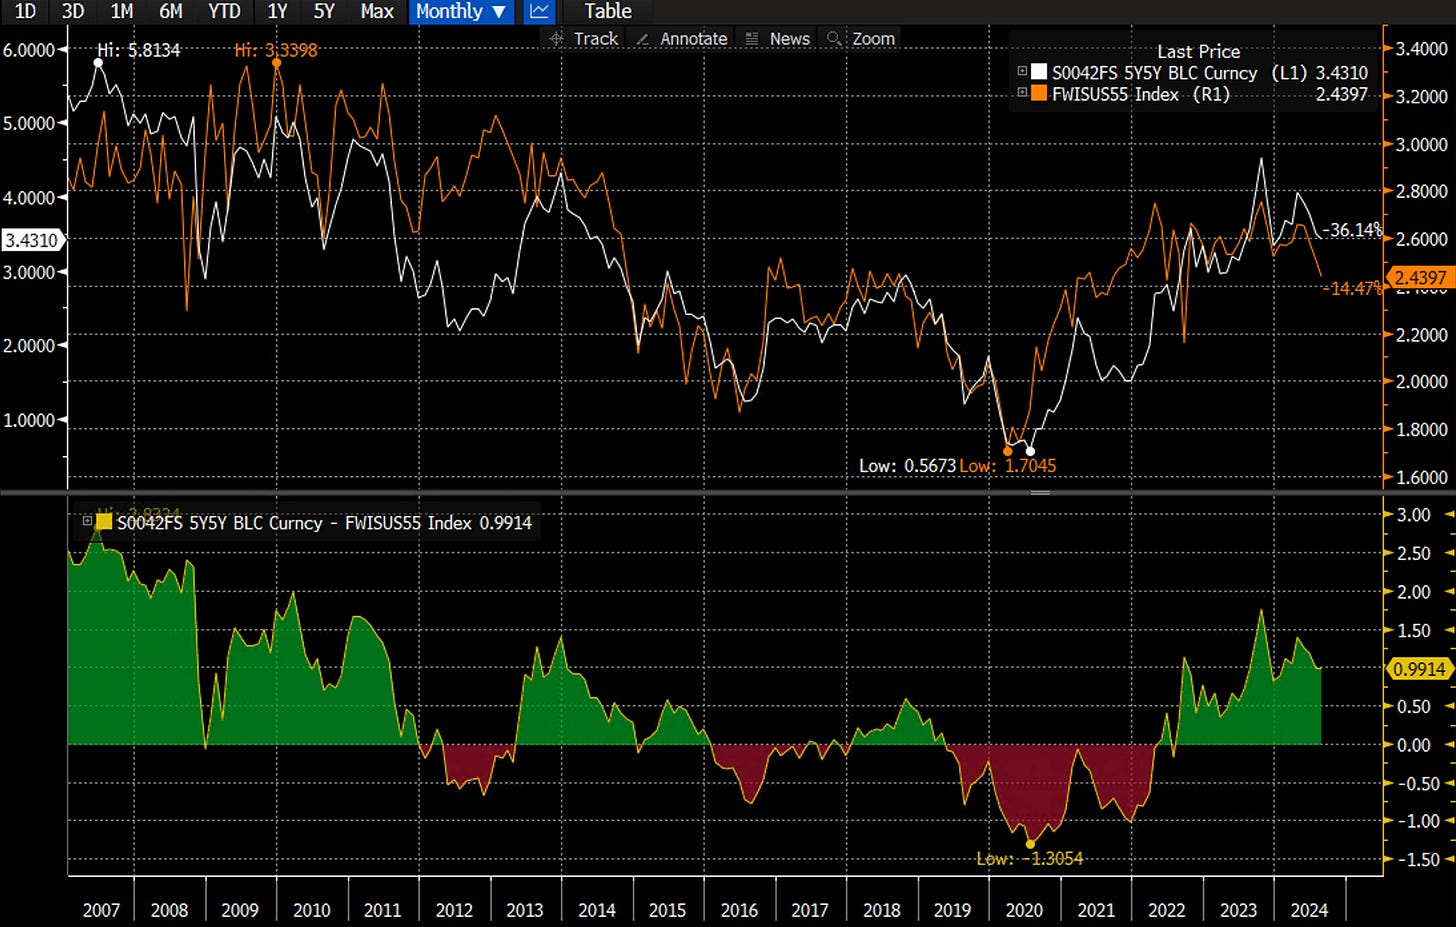
I asked the simple question on my Twitter feed whether 5y5y US real rates at around 1% are too high or too low. Sure, negative real rates were the norm in the QE and ZIRP world, and a return to such a world would certainly necessitate negative real yields. The arguments are relatively simple yet don’t answer the pressing question of where neutral real rates should be. R-Star is a theoretical concept, and my view is that it’s a non-stationary variable. All things being equal, I would suggest that it should be lower and possibly closer to or below the Fed’s own forecast of 0.5%.
I also received saucy comments when I asked on Monday morning, “What if risk rallies into the end of the week?”. At the time of writing, this “ridiculous” possibility isn’t too far-fetched. Sometimes, the craziest ideas work out.
The regime has shifted viciously from reflation to a recession in a matter of weeks, only supported by a handful of data. My thinking is that we will now toggle between recession and slowdown for a while until more clues become apparent. This makes it for a volatile environment while we shouldn’t forget that reflation, for now, is behind us.
By now, most of you will be familiar with the models and their signals. If not, please study the guide I have published.
The full book of 250+ charts covers the whole asset spectrum from equities, bonds, commodities, FX, and Crypto to give you the most extensive view. On average, it will generally provide a good 5-10 set-ups on a weekly basis.
A reminder that you can now also use my models in TradingView scripts, which I made available for subscribers to use on their charts for a fee. If you are interested, ping me an email with your TV username. Note that only paying subscribers will be granted access. No exceptions.
Let’s also read my friend Macro D’s recent thoughts on markets before engaging our scanning eyes across the multitude of charts that I have updated for you below.
Have a blessed and relaxing weekend! It’s been quite a ride.
Replenish nicely, and we will go again next week.


