

Friday Chart Book
April 26, 2024

From hereon, I am inviting a good friend and fellow macro enthusiast, “Macro D”, to contribute with his timely thoughts and observations. I am sure you saw me referencing him in the past few posts.
You know, looking at the world through more than one lens always adds value, and Mr. D, as I call him, has been an invaluable source of ideas and thoughts for my own purposes over many years. He is way more philosophically minded but usually hits the investing “Zeitgeist” with immaculate accuracy.
So I asked him whether he’d like to contribute his thoughts to my readers, which he graciously accepted. I am blessed and I hope you will be too. Take it away, D.
As usual, we are all here imagining what the various monetary policy committees of central banks around the world are telling each other at this exact moment.
This dilemma is stronger than me; I can't resist.
I will take a look at the various reasons behind the four Central Banks: the Reserve Bank of Australia (RBA), the ECB, the Federal Reserve, and the Bank of England (BoE).
Expectations on the moves of the central banks are mixed after the data from the beginning of the week: the disappointing US PMI indices have increased the probability of accommodating interventions by the Fed, while the better-than-expected European PMIs have decreased the expectations of cuts from the ECB.
But this time, we start from the southern hemisphere.
Australia’s first-quarter inflation data showed that the consumer price index rose 3.6% year-on-year, which was above expectations, strengthening the case for the central bank to keep rates at record highs.
This data suggests that price pressures are becoming stickier and strengthens the legitimate case for the central bank to hold interest rates at a 12-year high.
This data adds uncertainty around the timing of interest-rate cuts. Global energy prices are higher because of geopolitical tensions around the world, which is decisive and revealing for Australia as a big importer of crude oil. The country also faces domestic price pressures in areas such as healthcare and housing that aggravate the RBA's efforts to push inflation back into its 2% to 3% target band by the end of next year.

And in Europe? Let’s have a look at the below chart.

At first glance, it might also seem like a graph like any other. Some members of the ECB's monetary policy committee did not limit themselves to just one look, however. In fact, immediately after the release of the PMI data on Tuesday, rumours immediately emerged regarding the reduction of the hypothetical cuts already planned in Frankfurt.
Based on this preliminary data, the euro economy has produced growth. The composite PMI index takes into account both the service and manufacturing sectors and rose from 50.3 to 51.4 (expectations were at 50.8).
But let's be careful: growth does not affect all sectors. The lion's share was the services sector, rising for the third consecutive month and with the fastest rate in 11 months (the index went from 51.5 to 52.9 against expectations of 51.8).
And the manufacturing sector?. Here we had a contraction for the thirteenth consecutive month. The index fell from 46.1 to 45.6, but expectations had expected an increase to 46.5.
The result? Now, investors expect fewer cuts from the ECB.
And now, let’s now turn our attention across the pond.
Estimates on the dollar's trend for this year saw the greenback destined for a significant correction. However, these estimates have melted, thanks to the accommodative attitude of US monetary policymakers.
What are the current prospects?
The USD could end 2024 at much higher levels from here.
What would need to happen at this point? We will have strong currency pressure on many areas of the world, starting with those nations that are heavily dependent on Dollar financing or imports denominated in the reserve currency (obviously starting with crude oil).

How do we explain this situation? Let's rely for a moment on an expression dear to the punctual Mohamed El Erian, who recently said, "It is a jobs report that confirms US economic exceptionalism".
This exceptionalism is apparently producing economic growth, which, despite the high cost of money, seems destined to cause great trouble for all the major industrialized partners.
But is the US economy really in a boom phase?
The current situation which sees high growth, high employment and returns in the USA decidedly above its Western partners.
Since my natural reluctance to celebrate prevents me from being infected by the euphoria, I now quickly go down to the FED cellar to see if anyone has forgotten to bring some data upstairs (to the control room).
Let's start with the new home sales, which rose by more than 8% after yet another downward revision of almost 4%.

However, if the number of houses sold rises, I must deduce that many Americans are currently willing to buy at high prices and with mortgages that are certainly not cheap.
But, isn't it the case that what is being sold are not real houses but just shacks that no one would buy in normal times?
But here comes a new source of information that makes me question things.
The National Association of Realtors (NAR), after the +9.5% reported in February, declares that sales of existing homes in the United States decreased by 4.3% monthly in March 2024.
4.19 million homes were sold compared to 4.38 million in February and the 4.20 million units forecast by analysts. On a year-over-year basis, sales fell 3.7%. Home sales would find themselves in a “cul de sac” because interest rates are always on the edge. Since available jobs have increased from pre-COVID highs, the numbers indicate that there are more aspiring home buyers.
Therefore we have data coming from a private research institute that brings out very different numbers from those to which Powell refers.
On one side, we have Powell, who seems to be creating the ideal environment for a further rate hike based on persistent inflation, and on the other side, we have companies that speak of price deflation.
Yesterday’s US Q1 GDP was significantly lower than expected, but its price components were strong, adding upside risks to the upcoming core PCE report. Expectations were set for a softer March core PCE, but Q1 price data has given a hawkish forewarning. Q1 core PCE jumped to 3.7% vs 3.4% expected, 2.0% prior. GDP "weakness” is partly due to inventories and net exports, so details are a bit more positive even with consumption softer than expected.
Let’s now see what is happening in the UK.
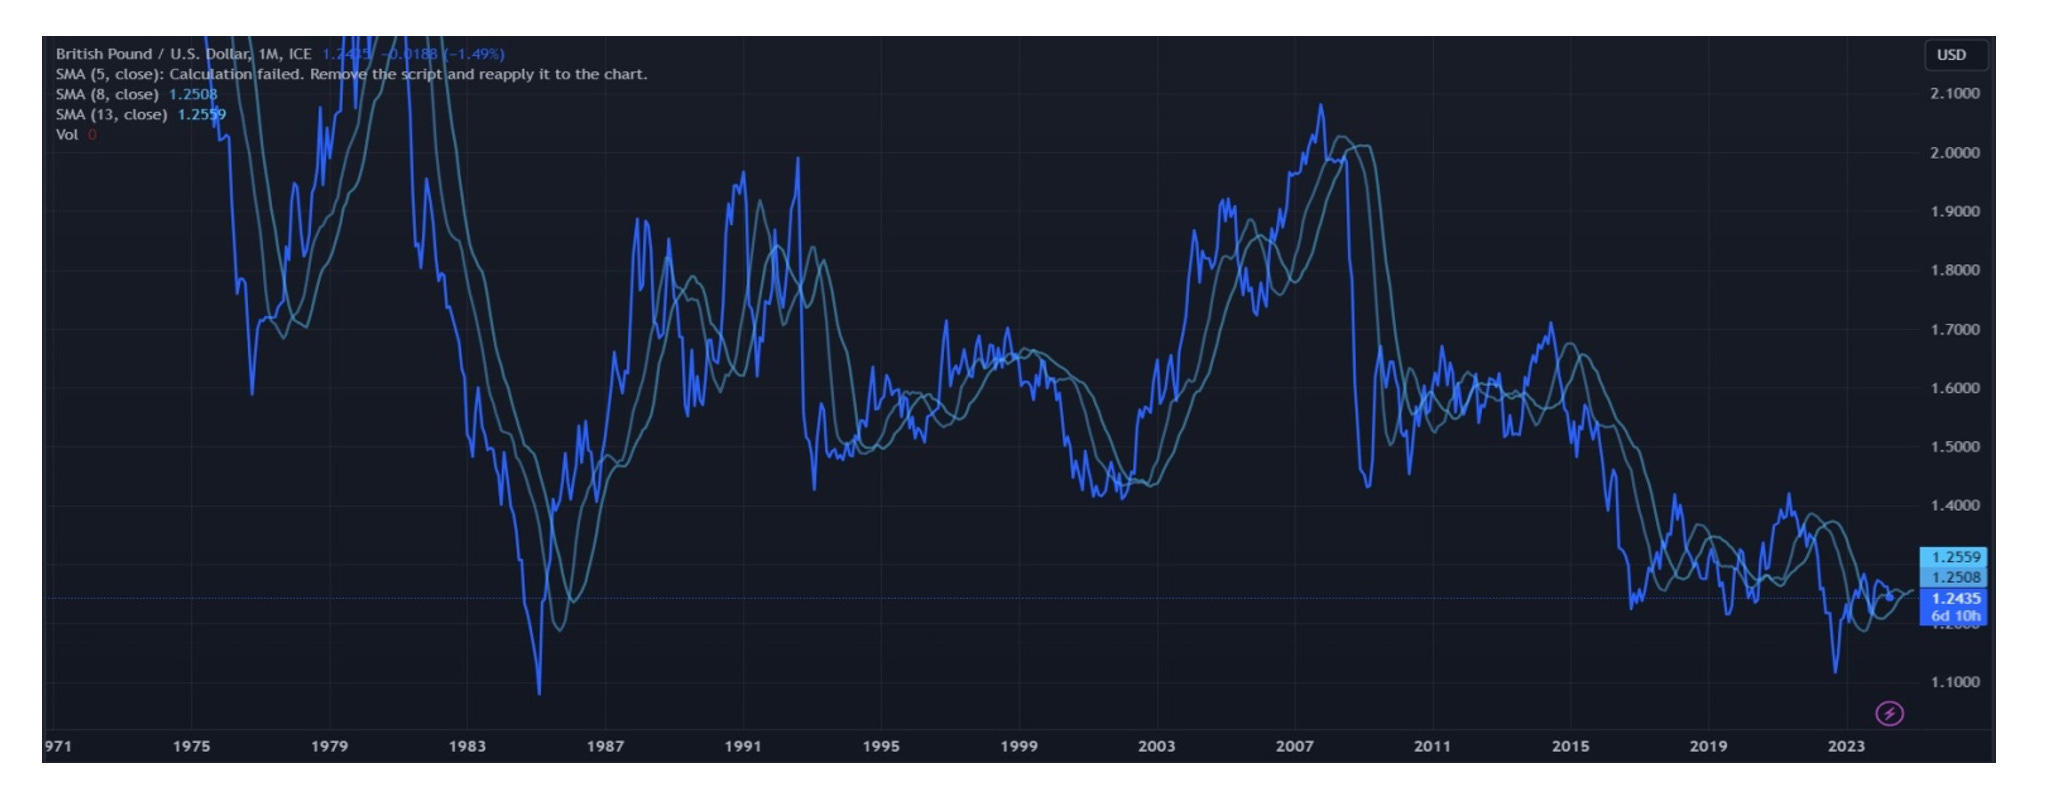
Discrepant economic outlooks and the yields on US and UK government bonds all contribute to the pound's fragility. Since the US dollar sharply grew in value in the middle of March, the GBP has been under pressure. While the Bank of England plans to lower interest rates this year, the Federal Reserve is slowly giving up on that vision.
The BoE's last remarks regarding interest rates, which suggested that the country's inflationary pressure was lessening and that a looming monetary policy easing was more likely, also contributed to the pound's drop.
Dave Ramsden, the deputy governor of the Bank of England, said last Friday that the inflation rate in the UK may not end up as high as the regulator had anticipated. Governor of the Bank of England Andrew Bailey said that May might see a 2% decline in inflation, which is the principal BoE target for the consumer price index.
Only if the economy continues to grow will the BoE be just one step away from cutting interest rates.
And so, I can imagine this scenario.

Let’s now turn our attention to the charts. By now, most of you will be familiar with the models and their signals. If not, please study the guide I have published. I have now also recorded a brief video tutorial, which you will find further below.
The full book of 250+ charts covers the whole asset spectrum from equities, bonds, commodities, FX and Crypto to give you the most extensive view. On average, it will generally provide a good 5-10 set-ups on a weekly basis.
A reminder that you can now also use my models in TradingView scripts, which I made available for subscribers to use on their charts for a fee. If you are interested, ping me an email with your TV username. Note that only paying subscribers will be granted access. No exceptions.
Let’s go!
