

Friday Chart Book
July 12, 2024

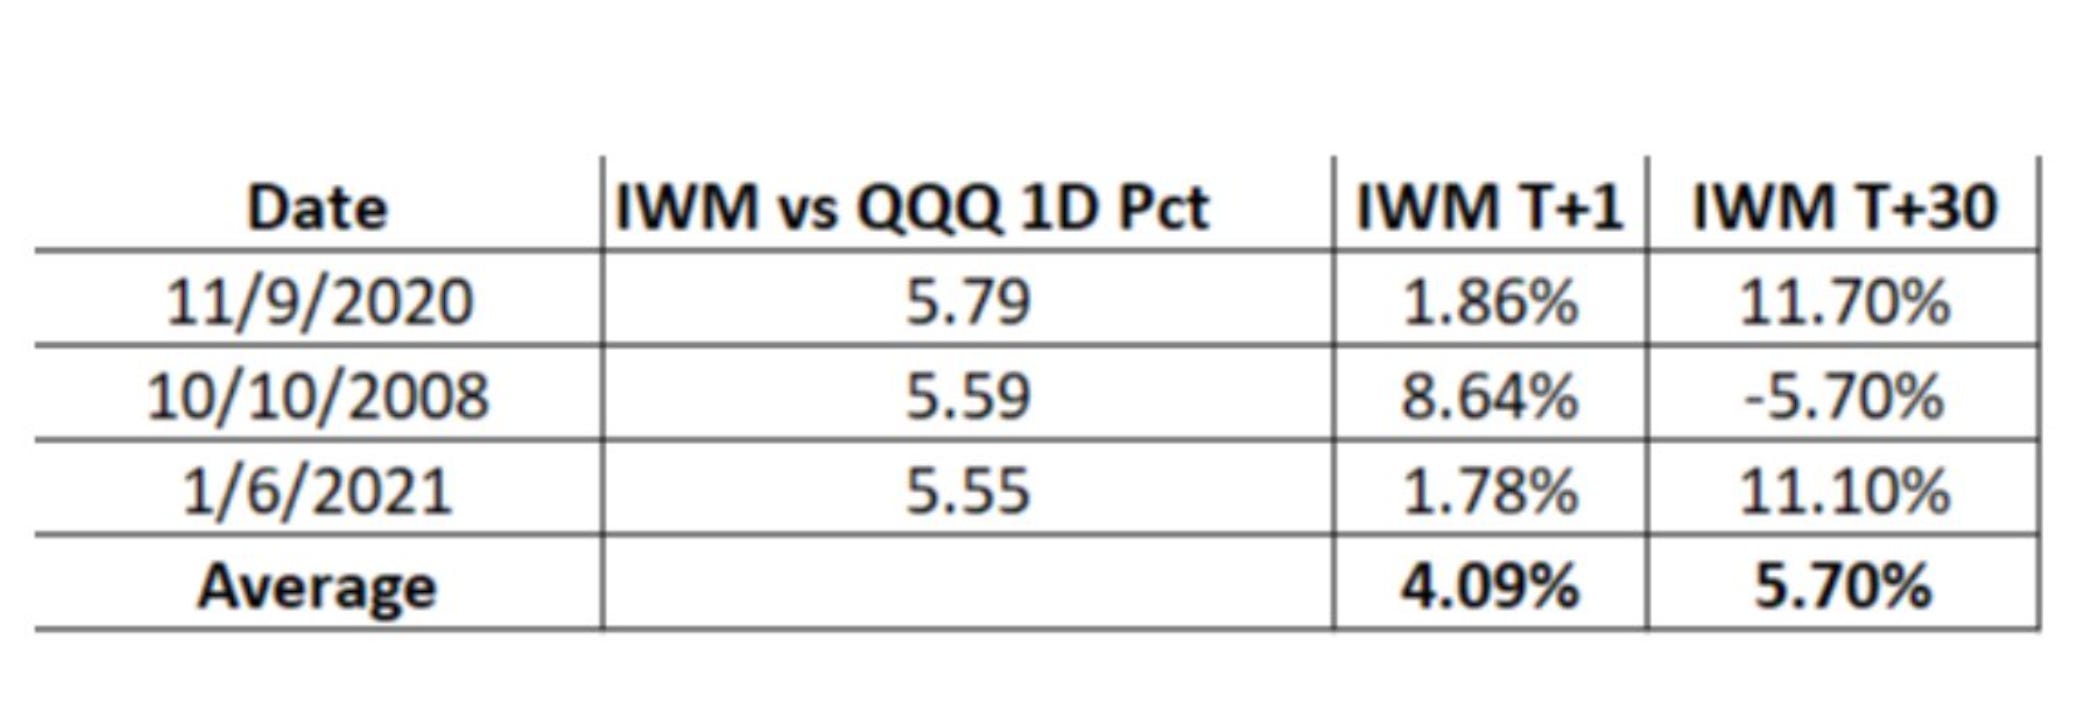
The inflation print anticipation did not disappoint in the slightest. Already subdued expectations for the print were surprised to the downside. The road becomes a bit clearer would it not have been for Friday’s hotter PPI print. Now, the focus is on how the possible divergence of CPI versus PCE will play out. The Fed, as we know, looks at PCE, so it will be interesting to hear from the members in the coming weeks about how they view it all from their perspective. The market’s reaction, however, is unambiguously dovish, with yield curves bull steepening further into and out of the print. The USD took a further knock while equities, well, initially greeted the disinflationary print only to then reverse sharply as Tech stocks found no support and put in a remarkable underperformance versus its previously lacklustre performance cousin Russell. This was no ordinary coincidence. Since the inception of the Russell in late 1978, there were only eight days where the index rallied 2% or more when the SPX had a down day. This was only the ninth observation! This all felt like a position unwind, which obviously must have been painful for whoever got caught in the move. The following table also highlights that the reversal will likely continue for a while, although we have only had a few previous occasions of a similar magnitude.
The other notable move was brought in just as the CPI number printed, with the BoJ intervening and bringing the narrow-ranging, low-vol march of USD/JPY to an abrupt halt. Well played, BoJ; they clearly had a plan and wanted to inflict the highest pain.

On this note, read the below piece to familiarise yourself with what is likely going on behind closed doors in Tokyo. In short, you don’t mess with Ueda-san. Furthermore, the cunning plan will now leave punters in two minds about whether to continue pushing for JPY-funded carry trades. Time will tell, but I think they put another strong line in the sand.
The BoJ , The Yen & Central Banking Chess

This is the second part of Macro D’s excursion into the BoJ and what it means for central banks globally. You can find the first part here. “A person's soul is hidden in their gaze, so we fear being looked in the eyes.” - Jim Morrison And the soul of a currency exchange?
US 2/10s steepened nicely in the aftermath of the CPI print and is continuing to steepen as I write. The forwards are still negative indicating a relatively attractive proposition to go for the trade at current levels.

Let’s now explore further thoughts on where we are in the current cycle and whether we are now entering a new phase. I will also share Macro D’s latest thoughts. We then turn our attention to the charts. By now, most of you will be familiar with the models and their signals. If not, please study the guide I have published.
The full book of 250+ charts covers the whole asset spectrum from equities, bonds, commodities, FX, and Crypto to give you the most extensive view. On average, it will generally provide a good 5-10 set-ups on a weekly basis.
A reminder that you can now also use my models in TradingView scripts, which I made available for subscribers to use on their charts for a fee. If you are interested, ping me an email with your TV username. Note that only paying subscribers will be granted access. No exceptions.
