

Friday Chart Book
Weak USD for how long? Is Gold telling us something?

A very good week is coming to an end. Who would have thought that an attack on Iranian nuclear facilities would be the trigger to send pretty much all asset markets higher during the week? Do we need constant walls of worry to climb? It certainly feels that way. The sharp fall in the oil price catapulted risk assets higher, especially in the US, while the USD continues its slide. Most interesting is the reaction in bonds, which seems to have caught a bid. I am happy, as I entered the front-end trade a week ago at pretty good levels. Certainly, luck played a role, as two Fed members initiated the dovish discussion, while Trump did his best to further undermine Powell by hurling insults at him and possibly leaking that he is already interviewing his replacement.
1y1y OIS now prices 125 bps of cuts, which is aggressive as we are just hitting ATHs in certain indices. There might be more to it, as we are entering a seasonally weaker growth period and people are positioning what could be a weak NFP print one week from now (it prints on Thursday as Friday is July 4th). The consensus is anticipating a 120k print, although the standard error of more than 100k could make a negative print possible. I doubt we are there yet.

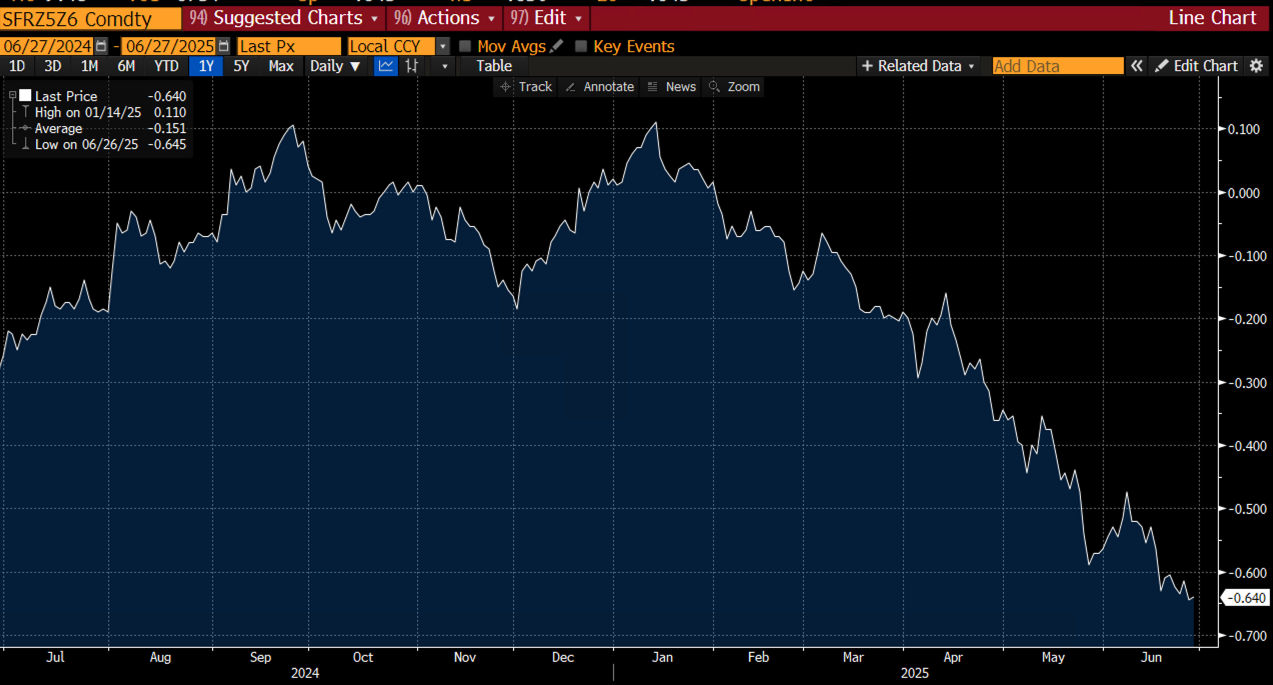
Much of the front-end rally is in the “reds” (1y1y forwards, SFRZ5Z6 below), as speculation of a dovish FOMC takeover mounts. I’m not so sure about that. After all, it’s a committee of 12 people and one or three political appointees won’t change the needle much. Much narrative has been given to the Fed’s independence, which is fair. I would have, however, anticipated that with such a bond rally, the long-end would have suffered, but it's holding up relatively well.
US 30-year yields are suddenly back at levels seen at the beginning of the year. Who would have thought? Admittedly driven lower by front-end rates, while curves are still steepening.

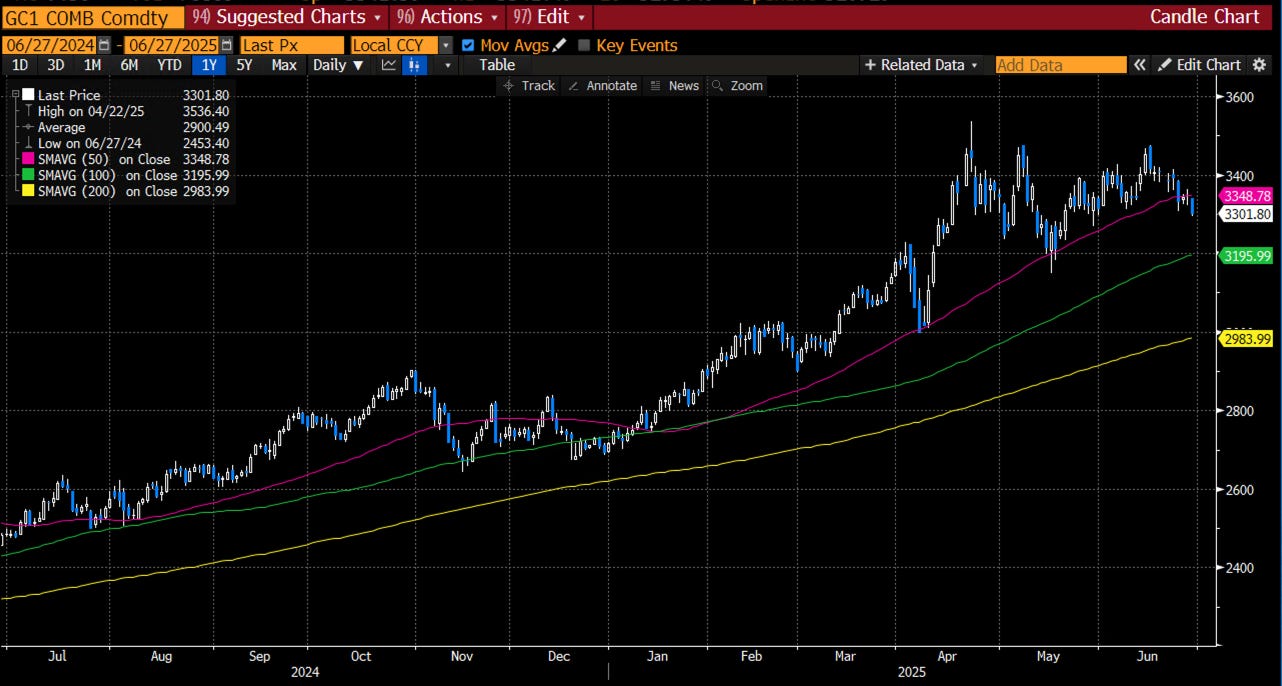
It’s early days, but maybe this is foreshadowing a stabilisation of popular fiscal narratives as well as tariff negotiations. To this extent, it’s also interesting to see how Gold has been underperforming recently and is further building a topping formation. Winding back to last year, it was front-running the USD weakness story. Is it now telling us that the USD weakness is soon ending?
It could be, however, when looking at the Bloomberg USD index, we have just broken the 2023 lows and are looking at a further extension of this current weakness. Talking to some sell-side researchers makes me believe that there is still more USD selling to be done. Institutional players are waiting for the Fed to cut, in order to hit the sell button. It’s a waiting game.

More importantly, this could set up for a more vicious and high volatility regime, in what Danny Dayan called the “doom loop”, which is usually observed in emerging economies. Go check out his excellent piece and analysis on this topic.
US equities had a great run and have quietly been outperforming their European counterpart during June.

What’s driving US equities is some short covering, although you could argue that the rally is broadening, which is usually a good sign. Seasonals in June and July are typically strong, so fading this rally seems premature at this stage. StateStreet has an excellent media tracker, which scans the market for which narratives are currently driving markets. Clearly, sentiment is very bullish, while liquidity considerations and the resolution of conflicts are pushing us higher. The lower right quadrant is also important, but currently, second-level factors are also impacting it, with the labour market (see comments above) also factoring in a possible dovish shift, which is currently seen as bullish for stocks. US growth, surprisingly, seems to be totally irrelevant currently. Also, tariffs have no mention. Makes me wonder whether July 9th might be a bigger deal than people think.

It’s been a great week at Paper Alfa. A warm welcome to new subscribers. Truly grateful for the support and the interest this place is gathering. The PAAM allocation model went long bonds for the first time since the beginning of April, and it has nailed the recent move so far. It has also remained long equities, which keeps on paying. The momentum and reversal model has alerted us nicely to some nice setups and is currently flashing warning signs in EURUSD and Bonds. More on that further below.
Paper Alfa’s 2025 buy-and-hold portfolio, meanwhile, has hit another high, now sitting at +13% YTD.

A reminder that you can now also use my models in TradingView scripts, which I made available for subscribers to use on their charts. This is not for free and incurs an additional cost.
If you are interested, ping me an email with your TV username. Note that only paying subscribers will be granted access. No exceptions.
If you are interested in exploring Paper Alfa’s full package, why not go for a 7-day trial?
Let’s now read some of Macro D’s latest thoughts on Trump and what happened in the Middle East, before we go through all 250+ chart setups across Rates, FX, Commodities, Crypto, Stocks, and ETFs.
Enjoy a great weekend!
