

Attack the Week (ATW)
February 23, 2025

Sunday Thoughts
Regime shifts can happen quickly, and they all have something in common when the turn comes. They are not obvious at first sight, typically involving a lot of pushback and denial at first. Indeed, regime shifts are always obvious in hindsight.
Friday’s SPX drawdown was the biggest of the year and the largest since the Fed’s hawkish December communication twist. Generally, softer data on the day and some online speculation about a renewed virus outbreak hurt risk appetite on the day.

We will never know exactly all the reasons why we find ourselves in this moment, but there is a chance that this might trigger a few chain reactions from here. First of all, historically, such a drawdown has occurred 89 times in the past 20 years. That’s 5047 daily observations, resulting in an occurrence probability of just below 2%. It’s not common, but “should” happen every few months.

In terms of the breadth of this sell-off, momentum and growth factor stocks were impacted most, which is unsurprising.

As macro investors, we are eagerly anticipating moments of accelerating market movements when volatility increases and consensus positioning is challenged. That’s where the money is made. Reasons are not found in spot data; they never are but in possible mounting downside risks, which were previously disregarded. It’s interesting how people seem to be now starting to see possible left-tail outcomes from DOGE’s cost-cutting exercise and general business and hiring uncertainties stemming from tariff and policy uncertainty. I don’t know how those factors will drive real economic outcomes, but I do know that negative reflexivity can impact financial markets and, by extension, influence forward economic realities.
How can things turn out? I stipulated before how to record equity ownership and the relative propensity of wealth effects coming from equity markets have supported consumer spending. A drawdown now is different to a few years ago, as the pain hits harder.
I’m looking at the below chart of US 10-year Treasuries, and I’m considering a similar path to what happened in April/May last year. I can envisage a bond rally to take us below 4% yields.

Implied Treasury Futures volatility has spiked from very low readings. “Insurance” is still relatively cheap. 25 delta call implied vol in the chart below.

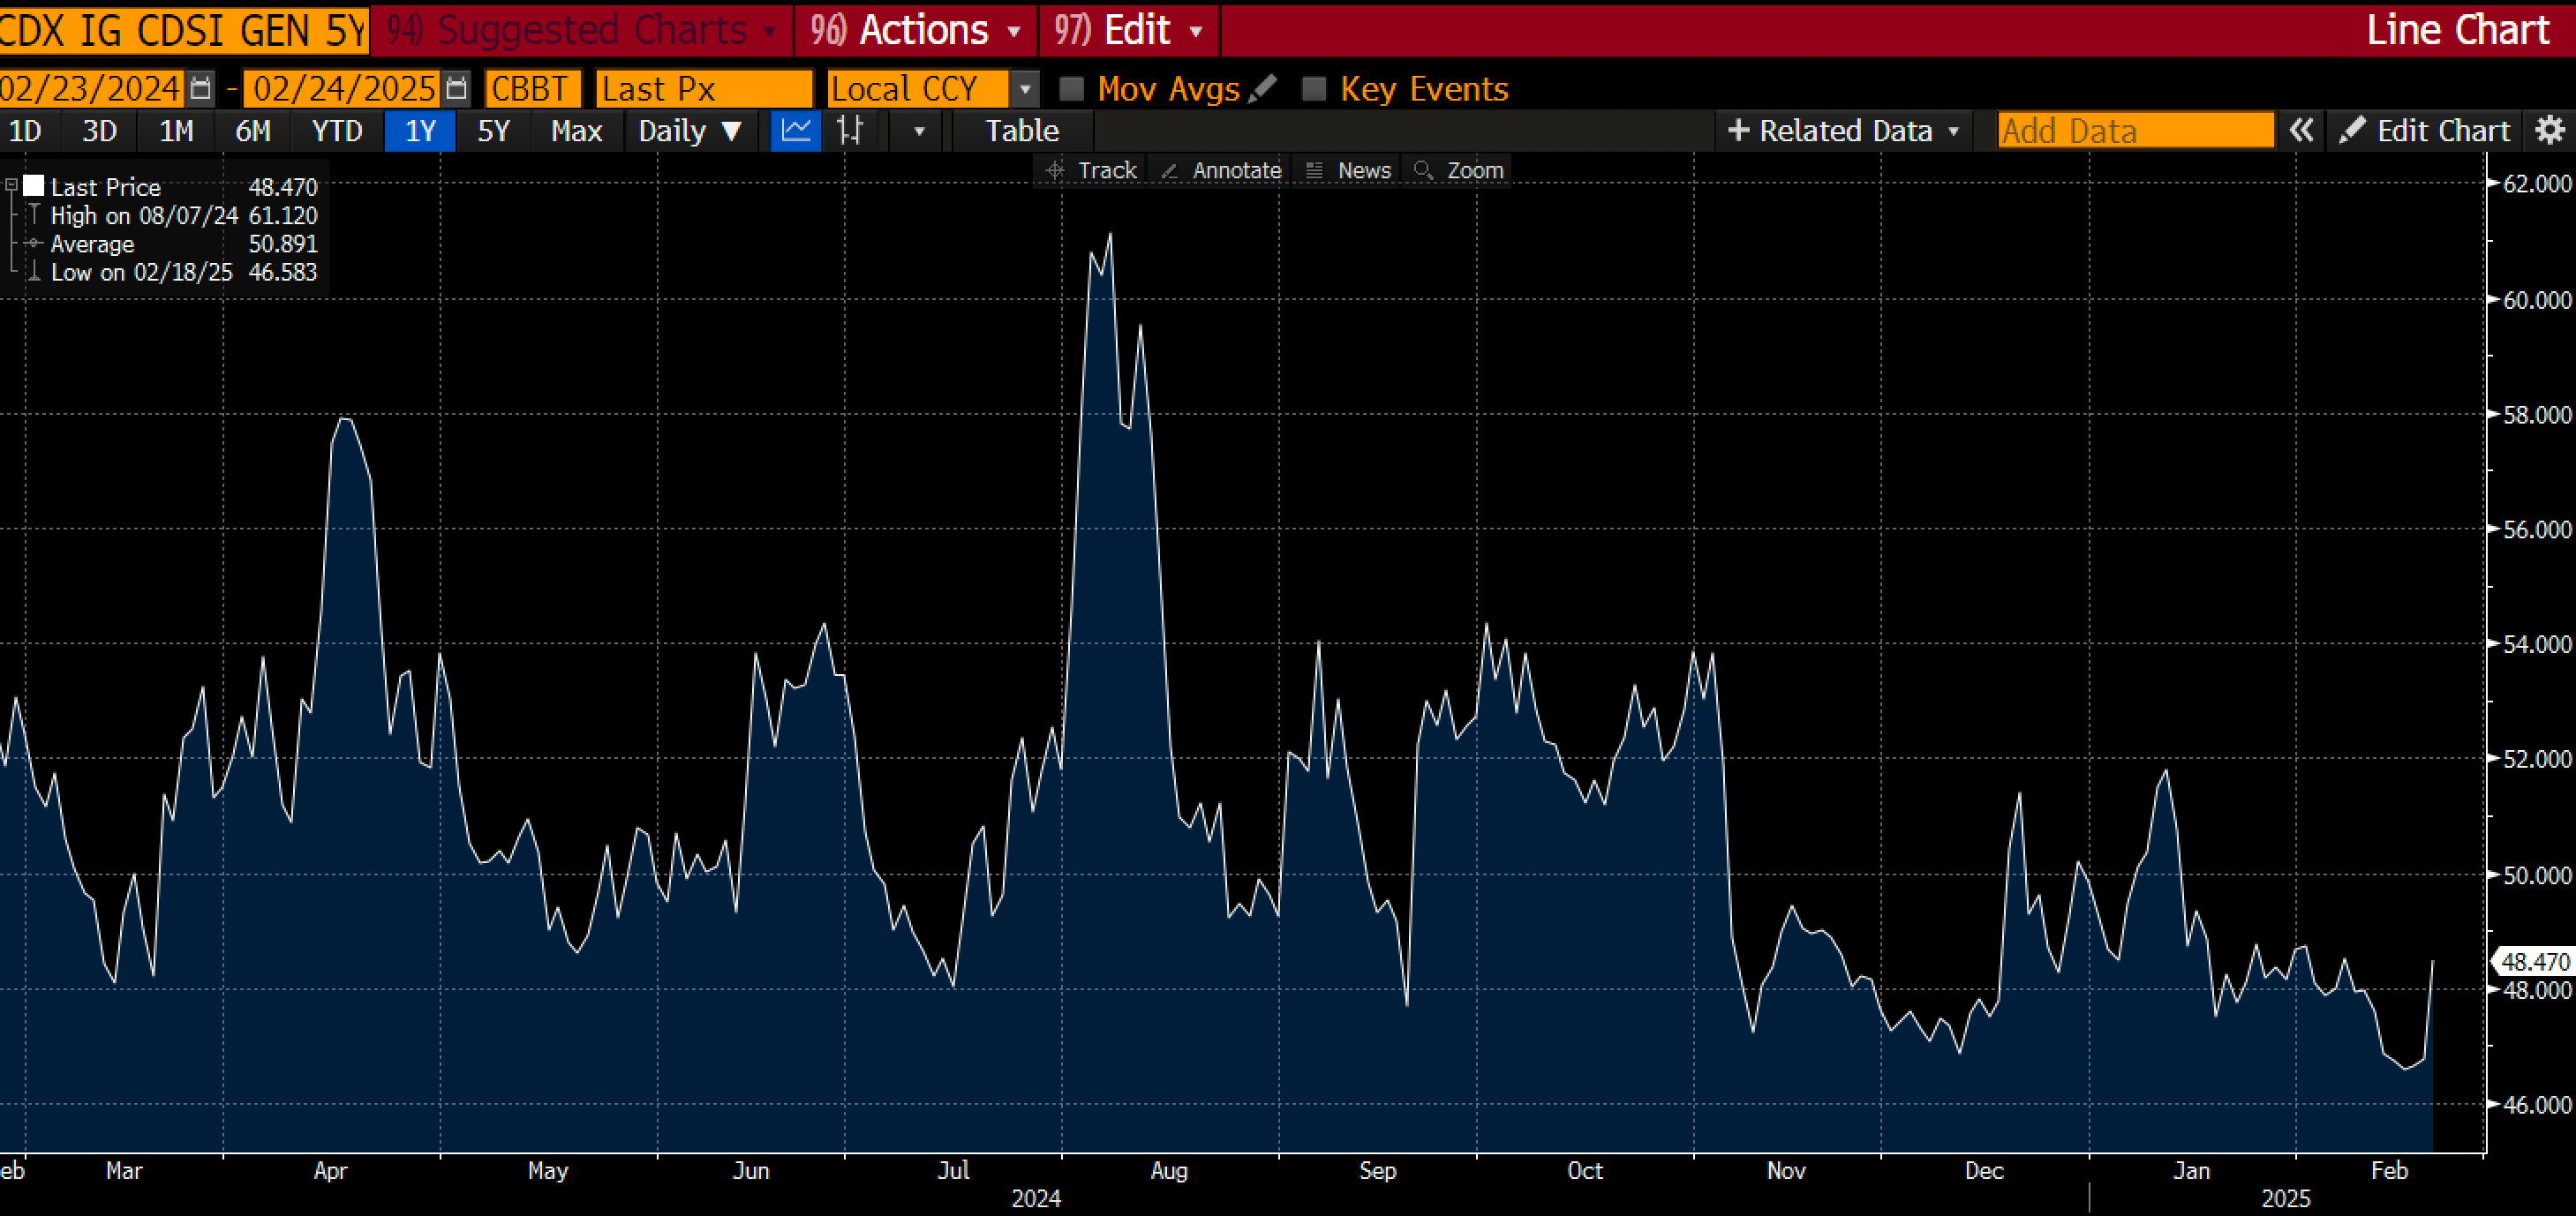
US investment-grade spreads hit their lows before now picking up again. While it’s not immediately concerning, valuations are vulnerable to a possible re-pricing.
The Fed is priced to just about cut another 2 times over the coming 7 meetings. They might, but if we have a repeat of what markets can price (not what they ultimately will be doing), things can get way more exciting from here.

Looking at 1y1y OIS vs spot SOFR over time reveals the following picture: as a macro investor, unless you strongly believe hikes are possible (I wouldn’t exclude this possibility), you have to bet on the market pricing in more cuts into the next year. It’s a trade I would have in my book.

In last week’s ATW, I shared observations on yields, Gold and the US Dollar and started preparing for a shift change. I might be early; it might never come, but I am prepared. As always, I will inform my readers of my thinking and potentially attractive set-ups across global macro markets. While many sit on the sidelines and look at past data to stipulate how macro should work, I’d rather make money in the process.
Let’s now read Macro D’s latest thinking before we briefly scan the week’s upcoming calendar. We then revisit some charts, which give us some interesting set-ups. As always, we close with a look at the output of our asset allocation model. Last week, it held allocations to both bonds and equities. Let’s see what it decides to do for the upcoming week.
Let’s go!
