

Attack the Week (ATW)
666 to 6666 / 3rd Fed Mandate / Charts / Asset Allocation Output

Sunday Thoughts
I spent Saturday walking with friends alongside the River Thames from Greenwich back to London Bridge and my beloved Borough Market. It was all in a bit more than 11k, with a few pit stops in some great pubs along the way. It felt like summer was passing quickly as temperatures deteriorated after 4 pm.

Changing seasons is something I am not especially prepared for, as I was rocking shorts and a T-shirt as it got cooler. People are generally not good at anticipating change, as I wasn’t the only one dressed like it was high summer.
Much talk was given to the seasonal pattern in stocks being relatively weak in September and into October. Aside from a few weaker sessions, stocks have defied those historical patterns and traded higher.
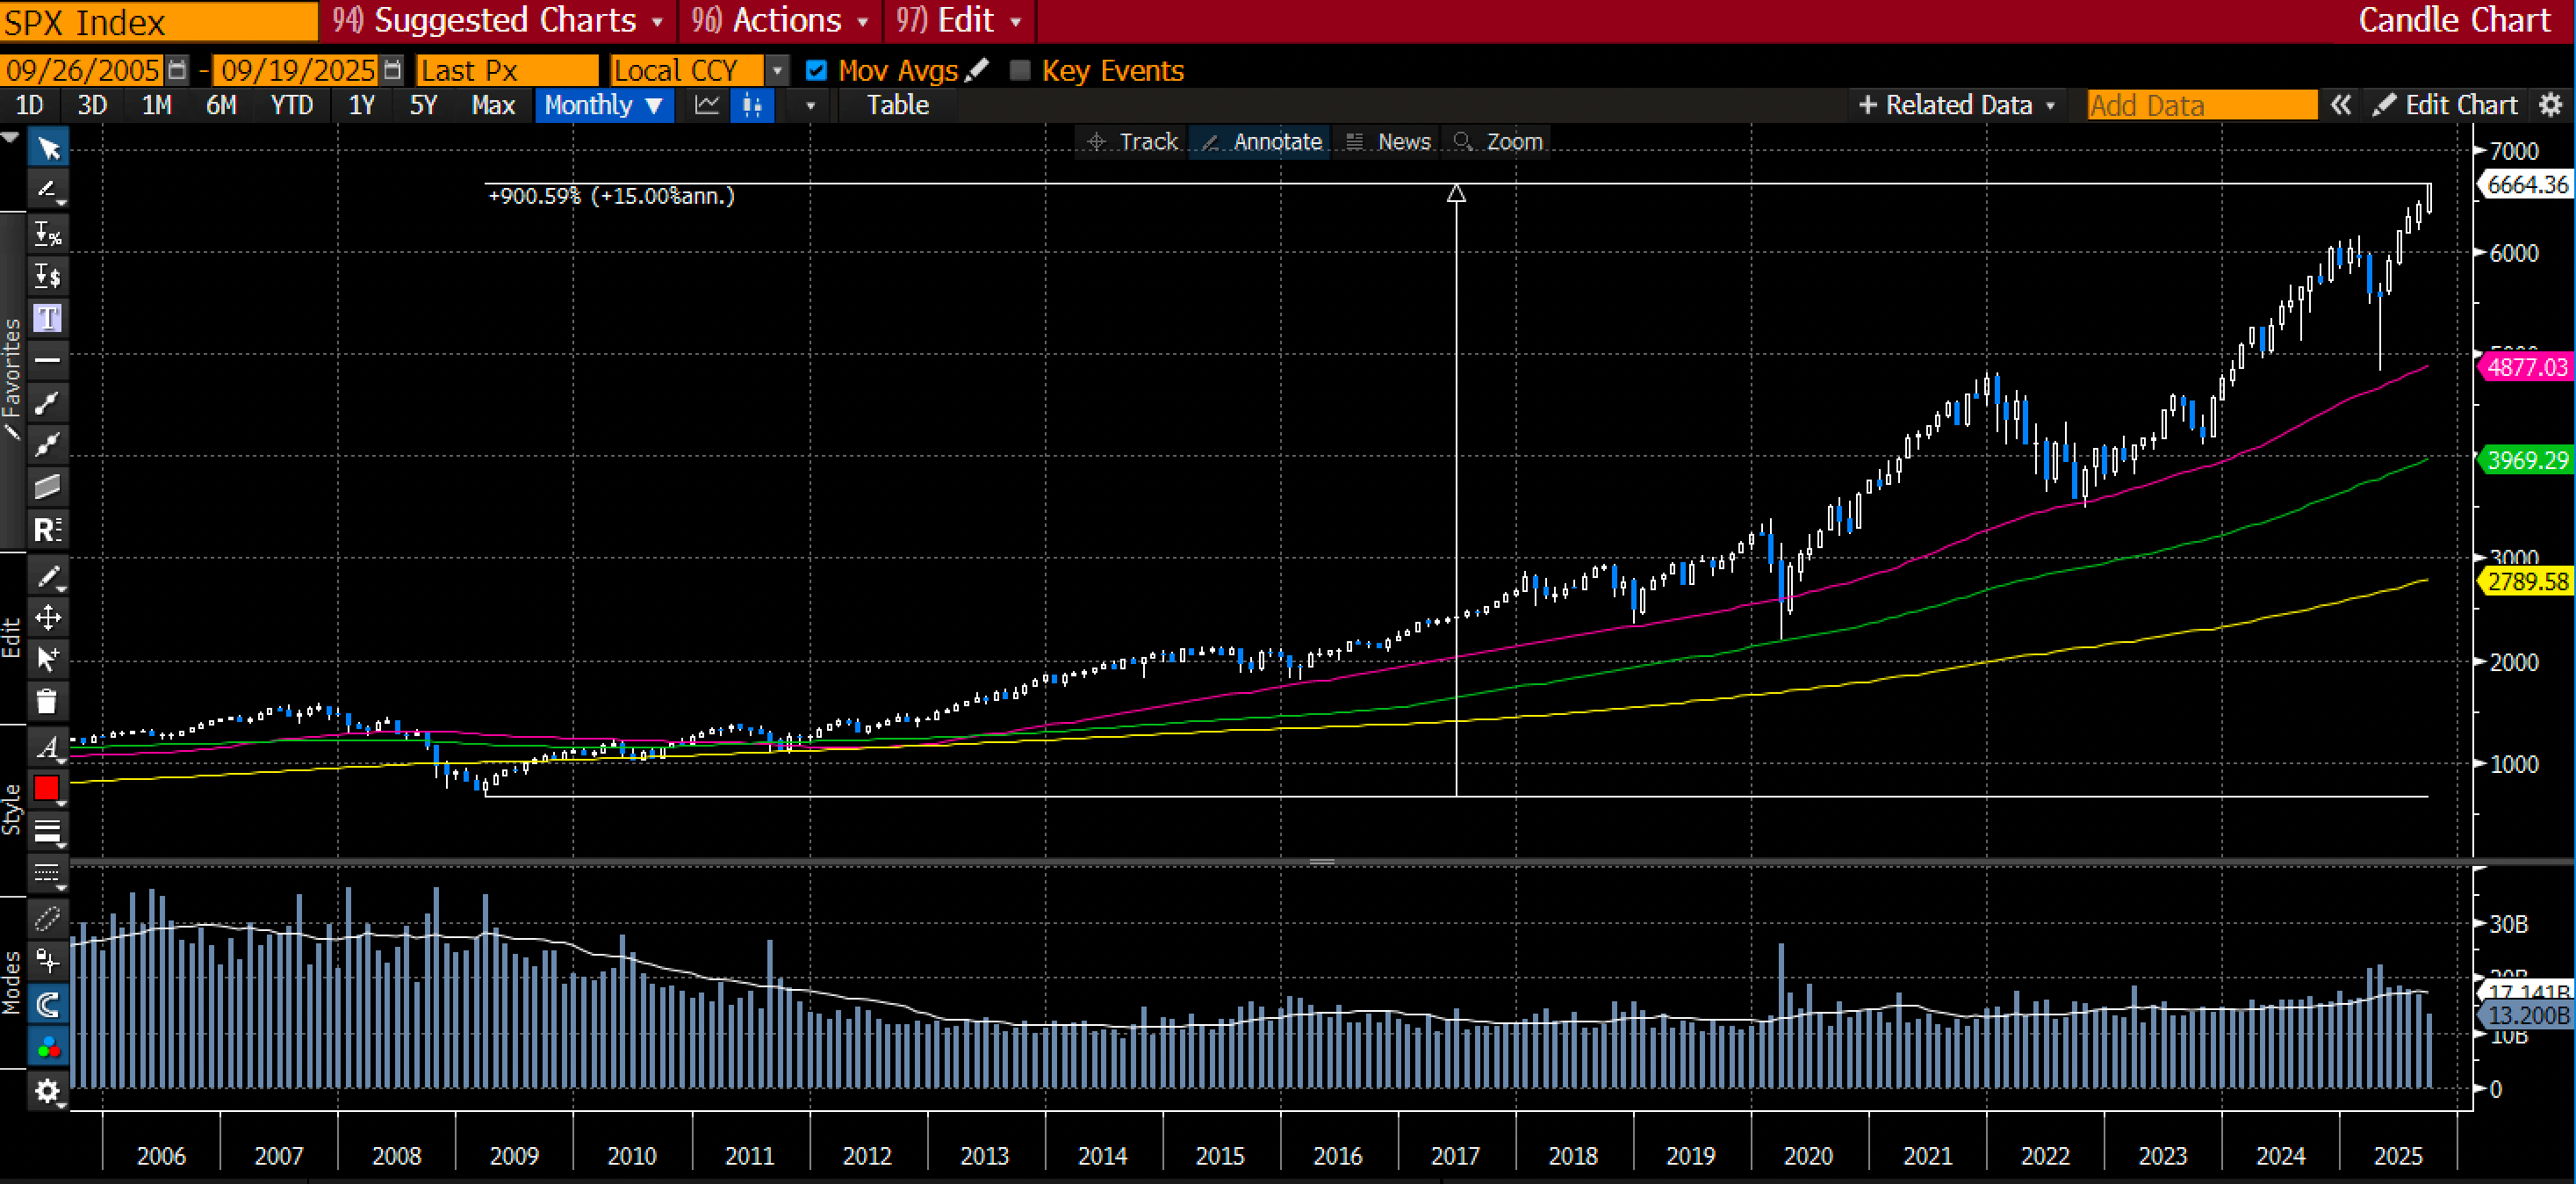
Le Shrub made a great observation that the SPX has now reached the multiple of the March 2009 low of 666 (the number of the beast), trading up to 6666, which was printed intra-day on Friday. Being a metal fan myself, I couldn’t help but notice that it’s a 10.01 x multiple from the lows, with the digits symbolising the "horn sign" of metal. Can you see it? Is it an omen that the lords of darkness are sending us as a sell signal?

Below is the Bloomberg chart, which shows the extension over time. It’s a 15% annualised return, which is roughly double its long-term compounding rate.
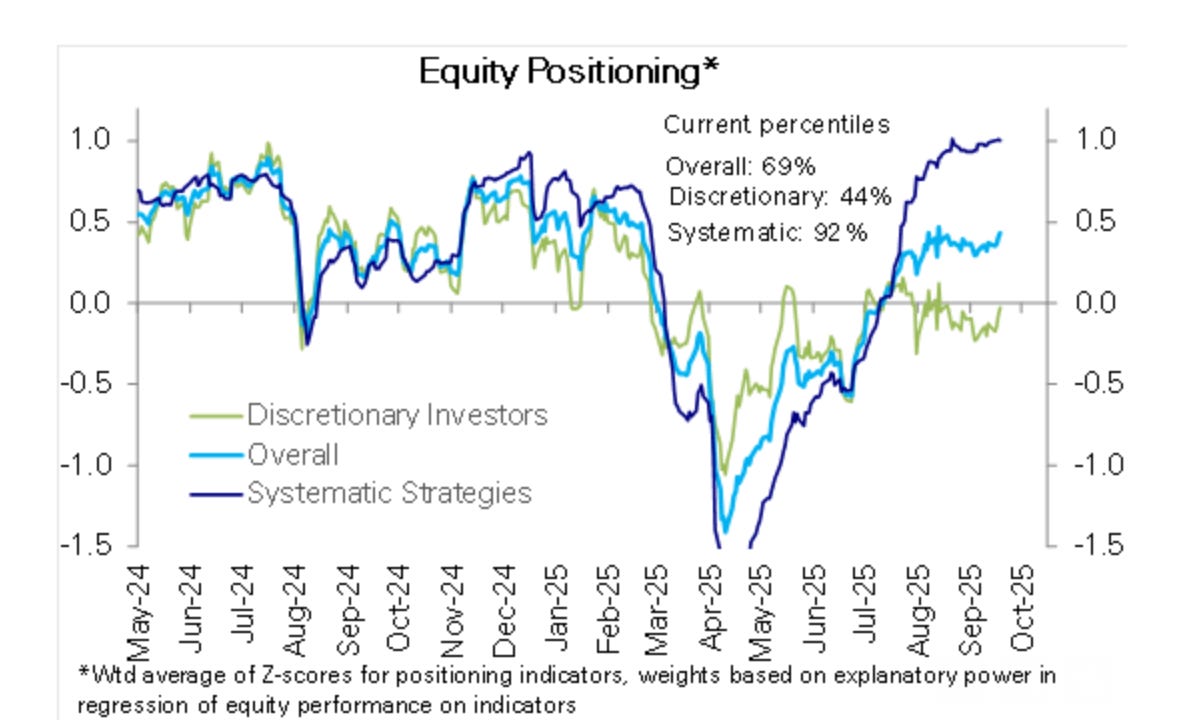
The rally's extent has many calling for a setback, drawing comparisons to previous episodes and bubbles. My models were indicating reversal signals, which have not produced any meaningful consolidation. This is frustrating for professional asset managers, who are waiting, possibly a bit underexposed, to add to their exposures. See the chart below.
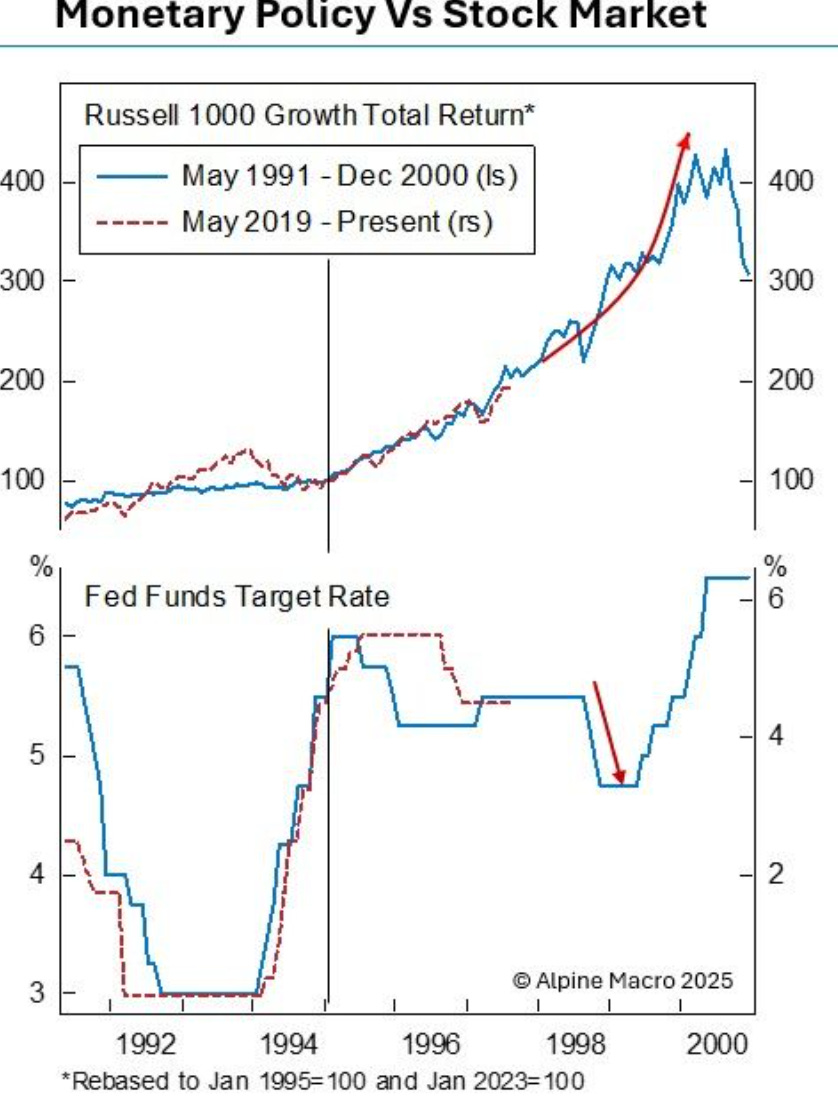
I am entertaining all possibilities, but I am also asking myself whether, supported by risk management rate cuts, the equity market could see an aggressive ascent into year-end. The excellent Chen Zhao from Alpine Macro posted the chart below, comparing the late 90s episode to the current environment.
Back then, the Fed hiked rates aggressively in 1994, made small cuts in 1995, and held steady until cutting again in late 1998 during the LTCM crisis. The S&P 500 dropped 20%, quickly rebounded, and then surged into a parabolic bull run led by tech giants like Intel, Dell, Cisco, and Microsoft.
Fast forward to now: after sharp rate hikes in 2022–2023, the Fed cut three times in 2024 and held steady — until today, when Powell announced another 25 bps cut with more in the pipeline. In April, the SPX fell nearly 20% on recession fears, rebounded in two months, and is now making new highs on expectations of further easing.
As always, we take note of the pulse of markets through various models that are informing us. The asset allocation model (see the latest output further below), alongside our momentum and reversal models, is giving us an insight into the behaviour of markets as we strive to deliver returns regardless of regime or conditions.
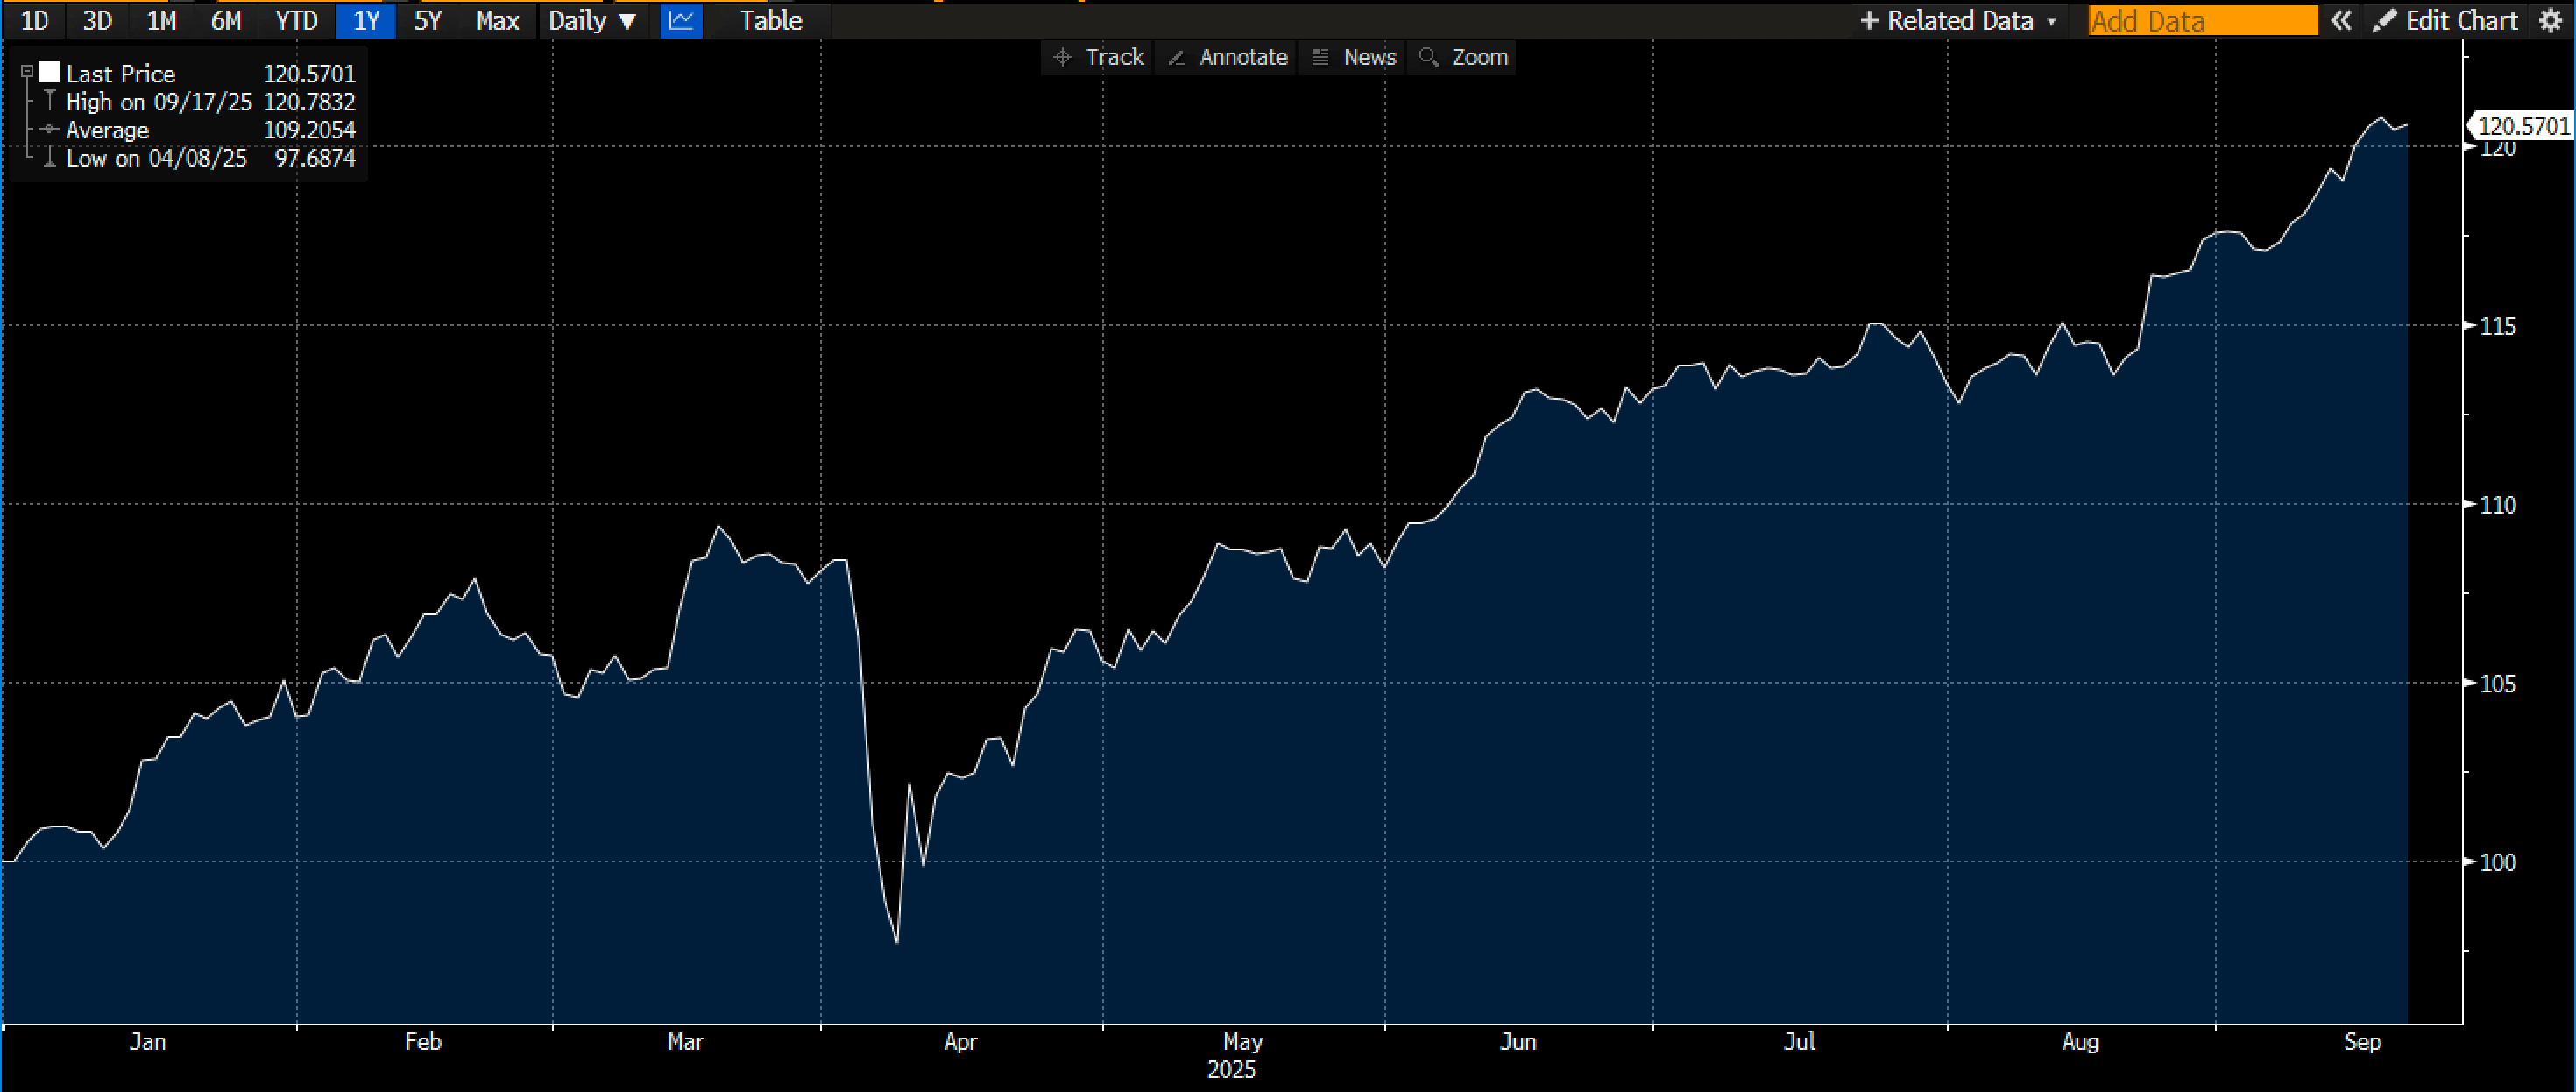
This is our buy-and-hold no-touch 2025 portfolio, which is now up 20.57% YTD in USD. We strive for more ahead.
Let’s now read some of Macro D’s thoughts on the Fed’s somewhat forgotten 3rd policy mandate, before we analyse the weekly calendar, some interesting chart setups and interpret the output of our weekly asset allocation model.
Let’s go!
